Warning: Undefined array key "lang" in /home/especiais/epsatisep/public_html/2020/EPS2020-wiki1/lib/plugins/wrap/helper.php on line 94
Warning: Undefined array key "id" in /home/especiais/epsatisep/public_html/2020/EPS2020-wiki1/lib/plugins/wrap/helper.php on line 117
Warning: Undefined array key "dir" in /home/especiais/epsatisep/public_html/2020/EPS2020-wiki1/lib/plugins/wrap/helper.php on line 128
Warning: Trying to access array offset on null in /home/especiais/epsatisep/public_html/2020/EPS2020-wiki1/lib/plugins/caption/syntax/reference.php on line 75
Warning: Undefined array key "lang" in /home/especiais/epsatisep/public_html/2020/EPS2020-wiki1/lib/plugins/wrap/helper.php on line 94
Warning: Undefined array key "id" in /home/especiais/epsatisep/public_html/2020/EPS2020-wiki1/lib/plugins/wrap/helper.php on line 117
Warning: Undefined array key "width" in /home/especiais/epsatisep/public_html/2020/EPS2020-wiki1/lib/plugins/wrap/helper.php on line 119
Warning: Undefined array key "dir" in /home/especiais/epsatisep/public_html/2020/EPS2020-wiki1/lib/plugins/wrap/helper.php on line 128
Warning: Undefined array key "lang" in /home/especiais/epsatisep/public_html/2020/EPS2020-wiki1/lib/plugins/wrap/helper.php on line 94
Warning: Undefined array key "id" in /home/especiais/epsatisep/public_html/2020/EPS2020-wiki1/lib/plugins/wrap/helper.php on line 117
Warning: Undefined array key "dir" in /home/especiais/epsatisep/public_html/2020/EPS2020-wiki1/lib/plugins/wrap/helper.php on line 128
Warning: Undefined array key "team" in /home/especiais/epsatisep/public_html/2020/EPS2020-wiki1/lib/plugins/caption/syntax/reference.php on line 75
Warning: Undefined array key "lang" in /home/especiais/epsatisep/public_html/2020/EPS2020-wiki1/lib/plugins/wrap/helper.php on line 94
Warning: Undefined array key "id" in /home/especiais/epsatisep/public_html/2020/EPS2020-wiki1/lib/plugins/wrap/helper.php on line 117
Warning: Undefined array key "width" in /home/especiais/epsatisep/public_html/2020/EPS2020-wiki1/lib/plugins/wrap/helper.php on line 119
Warning: Undefined array key "dir" in /home/especiais/epsatisep/public_html/2020/EPS2020-wiki1/lib/plugins/wrap/helper.php on line 128
Warning: Undefined array key "FunctionalTests" in /home/especiais/epsatisep/public_html/2020/EPS2020-wiki1/lib/plugins/caption/syntax/reference.php on line 75
Warning: Undefined array key "lang" in /home/especiais/epsatisep/public_html/2020/EPS2020-wiki1/lib/plugins/wrap/helper.php on line 94
Warning: Undefined array key "id" in /home/especiais/epsatisep/public_html/2020/EPS2020-wiki1/lib/plugins/wrap/helper.php on line 117
Warning: Undefined array key "width" in /home/especiais/epsatisep/public_html/2020/EPS2020-wiki1/lib/plugins/wrap/helper.php on line 119
Warning: Undefined array key "dir" in /home/especiais/epsatisep/public_html/2020/EPS2020-wiki1/lib/plugins/wrap/helper.php on line 128
Warning: Undefined array key "lang" in /home/especiais/epsatisep/public_html/2020/EPS2020-wiki1/lib/plugins/wrap/helper.php on line 94
Warning: Undefined array key "id" in /home/especiais/epsatisep/public_html/2020/EPS2020-wiki1/lib/plugins/wrap/helper.php on line 117
Warning: Undefined array key "dir" in /home/especiais/epsatisep/public_html/2020/EPS2020-wiki1/lib/plugins/wrap/helper.php on line 128
Warning: Undefined array key "scrum" in /home/especiais/epsatisep/public_html/2020/EPS2020-wiki1/lib/plugins/caption/syntax/reference.php on line 75
Warning: Undefined array key "lang" in /home/especiais/epsatisep/public_html/2020/EPS2020-wiki1/lib/plugins/wrap/helper.php on line 94
Warning: Undefined array key "id" in /home/especiais/epsatisep/public_html/2020/EPS2020-wiki1/lib/plugins/wrap/helper.php on line 117
Warning: Undefined array key "width" in /home/especiais/epsatisep/public_html/2020/EPS2020-wiki1/lib/plugins/wrap/helper.php on line 119
Warning: Undefined array key "dir" in /home/especiais/epsatisep/public_html/2020/EPS2020-wiki1/lib/plugins/wrap/helper.php on line 128
Warning: Undefined array key "reportstructure" in /home/especiais/epsatisep/public_html/2020/EPS2020-wiki1/lib/plugins/caption/syntax/reference.php on line 75
Warning: Undefined array key "lang" in /home/especiais/epsatisep/public_html/2020/EPS2020-wiki1/lib/plugins/wrap/helper.php on line 94
Warning: Undefined array key "id" in /home/especiais/epsatisep/public_html/2020/EPS2020-wiki1/lib/plugins/wrap/helper.php on line 117
Warning: Undefined array key "width" in /home/especiais/epsatisep/public_html/2020/EPS2020-wiki1/lib/plugins/wrap/helper.php on line 119
Warning: Undefined array key "dir" in /home/especiais/epsatisep/public_html/2020/EPS2020-wiki1/lib/plugins/wrap/helper.php on line 128
Warning: Undefined array key "lang" in /home/especiais/epsatisep/public_html/2020/EPS2020-wiki1/lib/plugins/wrap/helper.php on line 94
Warning: Undefined array key "id" in /home/especiais/epsatisep/public_html/2020/EPS2020-wiki1/lib/plugins/wrap/helper.php on line 117
Warning: Undefined array key "width" in /home/especiais/epsatisep/public_html/2020/EPS2020-wiki1/lib/plugins/wrap/helper.php on line 119
Warning: Undefined array key "dir" in /home/especiais/epsatisep/public_html/2020/EPS2020-wiki1/lib/plugins/wrap/helper.php on line 128
Warning: Undefined array key 1 in /home/especiais/epsatisep/public_html/2020/EPS2020-wiki1/lib/plugins/caption/syntax/caption.php on line 95
Warning: Undefined array key "comparisontable" in /home/especiais/epsatisep/public_html/2020/EPS2020-wiki1/lib/plugins/caption/syntax/reference.php on line 75
Warning: Undefined array key "lang" in /home/especiais/epsatisep/public_html/2020/EPS2020-wiki1/lib/plugins/wrap/helper.php on line 94
Warning: Undefined array key "id" in /home/especiais/epsatisep/public_html/2020/EPS2020-wiki1/lib/plugins/wrap/helper.php on line 117
Warning: Undefined array key "width" in /home/especiais/epsatisep/public_html/2020/EPS2020-wiki1/lib/plugins/wrap/helper.php on line 119
Warning: Undefined array key "dir" in /home/especiais/epsatisep/public_html/2020/EPS2020-wiki1/lib/plugins/wrap/helper.php on line 128
Warning: Undefined array key "lang" in /home/especiais/epsatisep/public_html/2020/EPS2020-wiki1/lib/plugins/wrap/helper.php on line 94
Warning: Undefined array key "id" in /home/especiais/epsatisep/public_html/2020/EPS2020-wiki1/lib/plugins/wrap/helper.php on line 117
Warning: Undefined array key "dir" in /home/especiais/epsatisep/public_html/2020/EPS2020-wiki1/lib/plugins/wrap/helper.php on line 128
Warning: Undefined array key "prosandcons" in /home/especiais/epsatisep/public_html/2020/EPS2020-wiki1/lib/plugins/caption/syntax/reference.php on line 75
Warning: Undefined array key "lang" in /home/especiais/epsatisep/public_html/2020/EPS2020-wiki1/lib/plugins/wrap/helper.php on line 94
Warning: Undefined array key "id" in /home/especiais/epsatisep/public_html/2020/EPS2020-wiki1/lib/plugins/wrap/helper.php on line 117
Warning: Undefined array key "width" in /home/especiais/epsatisep/public_html/2020/EPS2020-wiki1/lib/plugins/wrap/helper.php on line 119
Warning: Undefined array key "dir" in /home/especiais/epsatisep/public_html/2020/EPS2020-wiki1/lib/plugins/wrap/helper.php on line 128
Warning: Undefined array key "lang" in /home/especiais/epsatisep/public_html/2020/EPS2020-wiki1/lib/plugins/wrap/helper.php on line 94
Warning: Undefined array key "id" in /home/especiais/epsatisep/public_html/2020/EPS2020-wiki1/lib/plugins/wrap/helper.php on line 117
Warning: Undefined array key "dir" in /home/especiais/epsatisep/public_html/2020/EPS2020-wiki1/lib/plugins/wrap/helper.php on line 128
Warning: Undefined array key "fwbs" in /home/especiais/epsatisep/public_html/2020/EPS2020-wiki1/lib/plugins/caption/syntax/reference.php on line 75
Warning: Undefined array key "lang" in /home/especiais/epsatisep/public_html/2020/EPS2020-wiki1/lib/plugins/wrap/helper.php on line 94
Warning: Undefined array key "id" in /home/especiais/epsatisep/public_html/2020/EPS2020-wiki1/lib/plugins/wrap/helper.php on line 117
Warning: Undefined array key "width" in /home/especiais/epsatisep/public_html/2020/EPS2020-wiki1/lib/plugins/wrap/helper.php on line 119
Warning: Undefined array key "dir" in /home/especiais/epsatisep/public_html/2020/EPS2020-wiki1/lib/plugins/wrap/helper.php on line 128
Warning: Undefined array key "fgantt" in /home/especiais/epsatisep/public_html/2020/EPS2020-wiki1/lib/plugins/caption/syntax/reference.php on line 75
Warning: Undefined array key "lang" in /home/especiais/epsatisep/public_html/2020/EPS2020-wiki1/lib/plugins/wrap/helper.php on line 94
Warning: Undefined array key "id" in /home/especiais/epsatisep/public_html/2020/EPS2020-wiki1/lib/plugins/wrap/helper.php on line 117
Warning: Undefined array key "width" in /home/especiais/epsatisep/public_html/2020/EPS2020-wiki1/lib/plugins/wrap/helper.php on line 119
Warning: Undefined array key "dir" in /home/especiais/epsatisep/public_html/2020/EPS2020-wiki1/lib/plugins/wrap/helper.php on line 128
Warning: Undefined array key "matcoststab" in /home/especiais/epsatisep/public_html/2020/EPS2020-wiki1/lib/plugins/caption/syntax/reference.php on line 75
Warning: Undefined array key "lang" in /home/especiais/epsatisep/public_html/2020/EPS2020-wiki1/lib/plugins/wrap/helper.php on line 94
Warning: Undefined array key "id" in /home/especiais/epsatisep/public_html/2020/EPS2020-wiki1/lib/plugins/wrap/helper.php on line 117
Warning: Undefined array key "width" in /home/especiais/epsatisep/public_html/2020/EPS2020-wiki1/lib/plugins/wrap/helper.php on line 119
Warning: Undefined array key "dir" in /home/especiais/epsatisep/public_html/2020/EPS2020-wiki1/lib/plugins/wrap/helper.php on line 128
Warning: Undefined array key "lang" in /home/especiais/epsatisep/public_html/2020/EPS2020-wiki1/lib/plugins/wrap/helper.php on line 94
Warning: Undefined array key "id" in /home/especiais/epsatisep/public_html/2020/EPS2020-wiki1/lib/plugins/wrap/helper.php on line 117
Warning: Undefined array key "dir" in /home/especiais/epsatisep/public_html/2020/EPS2020-wiki1/lib/plugins/wrap/helper.php on line 128
Warning: Undefined array key "labcosttab" in /home/especiais/epsatisep/public_html/2020/EPS2020-wiki1/lib/plugins/caption/syntax/reference.php on line 75
Warning: Undefined array key "lang" in /home/especiais/epsatisep/public_html/2020/EPS2020-wiki1/lib/plugins/wrap/helper.php on line 94
Warning: Undefined array key "id" in /home/especiais/epsatisep/public_html/2020/EPS2020-wiki1/lib/plugins/wrap/helper.php on line 117
Warning: Undefined array key "width" in /home/especiais/epsatisep/public_html/2020/EPS2020-wiki1/lib/plugins/wrap/helper.php on line 119
Warning: Undefined array key "dir" in /home/especiais/epsatisep/public_html/2020/EPS2020-wiki1/lib/plugins/wrap/helper.php on line 128
Warning: Undefined array key "lang" in /home/especiais/epsatisep/public_html/2020/EPS2020-wiki1/lib/plugins/wrap/helper.php on line 94
Warning: Undefined array key "id" in /home/especiais/epsatisep/public_html/2020/EPS2020-wiki1/lib/plugins/wrap/helper.php on line 117
Warning: Undefined array key "dir" in /home/especiais/epsatisep/public_html/2020/EPS2020-wiki1/lib/plugins/wrap/helper.php on line 128
Warning: Undefined array key "responsibility" in /home/especiais/epsatisep/public_html/2020/EPS2020-wiki1/lib/plugins/caption/syntax/reference.php on line 75
Warning: Undefined array key "lang" in /home/especiais/epsatisep/public_html/2020/EPS2020-wiki1/lib/plugins/wrap/helper.php on line 94
Warning: Undefined array key "id" in /home/especiais/epsatisep/public_html/2020/EPS2020-wiki1/lib/plugins/wrap/helper.php on line 117
Warning: Undefined array key "width" in /home/especiais/epsatisep/public_html/2020/EPS2020-wiki1/lib/plugins/wrap/helper.php on line 119
Warning: Undefined array key "dir" in /home/especiais/epsatisep/public_html/2020/EPS2020-wiki1/lib/plugins/wrap/helper.php on line 128
Warning: Undefined array key "lang" in /home/especiais/epsatisep/public_html/2020/EPS2020-wiki1/lib/plugins/wrap/helper.php on line 94
Warning: Undefined array key "id" in /home/especiais/epsatisep/public_html/2020/EPS2020-wiki1/lib/plugins/wrap/helper.php on line 117
Warning: Undefined array key "dir" in /home/especiais/epsatisep/public_html/2020/EPS2020-wiki1/lib/plugins/wrap/helper.php on line 128
Warning: Undefined array key "stakeholdertab" in /home/especiais/epsatisep/public_html/2020/EPS2020-wiki1/lib/plugins/caption/syntax/reference.php on line 75
Warning: Undefined array key "lang" in /home/especiais/epsatisep/public_html/2020/EPS2020-wiki1/lib/plugins/wrap/helper.php on line 94
Warning: Undefined array key "id" in /home/especiais/epsatisep/public_html/2020/EPS2020-wiki1/lib/plugins/wrap/helper.php on line 117
Warning: Undefined array key "width" in /home/especiais/epsatisep/public_html/2020/EPS2020-wiki1/lib/plugins/wrap/helper.php on line 119
Warning: Undefined array key "dir" in /home/especiais/epsatisep/public_html/2020/EPS2020-wiki1/lib/plugins/wrap/helper.php on line 128
Warning: Undefined array key "lang" in /home/especiais/epsatisep/public_html/2020/EPS2020-wiki1/lib/plugins/wrap/helper.php on line 94
Warning: Undefined array key "id" in /home/especiais/epsatisep/public_html/2020/EPS2020-wiki1/lib/plugins/wrap/helper.php on line 117
Warning: Undefined array key "dir" in /home/especiais/epsatisep/public_html/2020/EPS2020-wiki1/lib/plugins/wrap/helper.php on line 128
Warning: Undefined array key "lang" in /home/especiais/epsatisep/public_html/2020/EPS2020-wiki1/lib/plugins/wrap/helper.php on line 94
Warning: Undefined array key "id" in /home/especiais/epsatisep/public_html/2020/EPS2020-wiki1/lib/plugins/wrap/helper.php on line 117
Warning: Undefined array key "width" in /home/especiais/epsatisep/public_html/2020/EPS2020-wiki1/lib/plugins/wrap/helper.php on line 119
Warning: Undefined array key "dir" in /home/especiais/epsatisep/public_html/2020/EPS2020-wiki1/lib/plugins/wrap/helper.php on line 128
Warning: Undefined array key "lang" in /home/especiais/epsatisep/public_html/2020/EPS2020-wiki1/lib/plugins/wrap/helper.php on line 94
Warning: Undefined array key "id" in /home/especiais/epsatisep/public_html/2020/EPS2020-wiki1/lib/plugins/wrap/helper.php on line 117
Warning: Undefined array key "dir" in /home/especiais/epsatisep/public_html/2020/EPS2020-wiki1/lib/plugins/wrap/helper.php on line 128
Warning: Undefined array key "explanationtab" in /home/especiais/epsatisep/public_html/2020/EPS2020-wiki1/lib/plugins/caption/syntax/reference.php on line 75
Warning: Undefined array key "lang" in /home/especiais/epsatisep/public_html/2020/EPS2020-wiki1/lib/plugins/wrap/helper.php on line 94
Warning: Undefined array key "id" in /home/especiais/epsatisep/public_html/2020/EPS2020-wiki1/lib/plugins/wrap/helper.php on line 117
Warning: Undefined array key "width" in /home/especiais/epsatisep/public_html/2020/EPS2020-wiki1/lib/plugins/wrap/helper.php on line 119
Warning: Undefined array key "dir" in /home/especiais/epsatisep/public_html/2020/EPS2020-wiki1/lib/plugins/wrap/helper.php on line 128
Warning: Undefined array key "lang" in /home/especiais/epsatisep/public_html/2020/EPS2020-wiki1/lib/plugins/wrap/helper.php on line 94
Warning: Undefined array key "id" in /home/especiais/epsatisep/public_html/2020/EPS2020-wiki1/lib/plugins/wrap/helper.php on line 117
Warning: Undefined array key "dir" in /home/especiais/epsatisep/public_html/2020/EPS2020-wiki1/lib/plugins/wrap/helper.php on line 128
Warning: Undefined array key "lang" in /home/especiais/epsatisep/public_html/2020/EPS2020-wiki1/lib/plugins/wrap/helper.php on line 94
Warning: Undefined array key "id" in /home/especiais/epsatisep/public_html/2020/EPS2020-wiki1/lib/plugins/wrap/helper.php on line 117
Warning: Undefined array key "width" in /home/especiais/epsatisep/public_html/2020/EPS2020-wiki1/lib/plugins/wrap/helper.php on line 119
Warning: Undefined array key "dir" in /home/especiais/epsatisep/public_html/2020/EPS2020-wiki1/lib/plugins/wrap/helper.php on line 128
Warning: Undefined array key 1 in /home/especiais/epsatisep/public_html/2020/EPS2020-wiki1/lib/plugins/caption/syntax/caption.php on line 95
Warning: Undefined array key "lang" in /home/especiais/epsatisep/public_html/2020/EPS2020-wiki1/lib/plugins/wrap/helper.php on line 94
Warning: Undefined array key "id" in /home/especiais/epsatisep/public_html/2020/EPS2020-wiki1/lib/plugins/wrap/helper.php on line 117
Warning: Undefined array key "dir" in /home/especiais/epsatisep/public_html/2020/EPS2020-wiki1/lib/plugins/wrap/helper.php on line 128
Warning: Undefined array key "lang" in /home/especiais/epsatisep/public_html/2020/EPS2020-wiki1/lib/plugins/wrap/helper.php on line 94
Warning: Undefined array key "id" in /home/especiais/epsatisep/public_html/2020/EPS2020-wiki1/lib/plugins/wrap/helper.php on line 117
Warning: Undefined array key "width" in /home/especiais/epsatisep/public_html/2020/EPS2020-wiki1/lib/plugins/wrap/helper.php on line 119
Warning: Undefined array key "dir" in /home/especiais/epsatisep/public_html/2020/EPS2020-wiki1/lib/plugins/wrap/helper.php on line 128
Warning: Undefined array key 1 in /home/especiais/epsatisep/public_html/2020/EPS2020-wiki1/lib/plugins/caption/syntax/caption.php on line 95
Warning: Undefined array key "globalsprintplan" in /home/especiais/epsatisep/public_html/2020/EPS2020-wiki1/lib/plugins/caption/syntax/reference.php on line 75
Warning: Undefined array key "lang" in /home/especiais/epsatisep/public_html/2020/EPS2020-wiki1/lib/plugins/wrap/helper.php on line 94
Warning: Undefined array key "id" in /home/especiais/epsatisep/public_html/2020/EPS2020-wiki1/lib/plugins/wrap/helper.php on line 117
Warning: Undefined array key "width" in /home/especiais/epsatisep/public_html/2020/EPS2020-wiki1/lib/plugins/wrap/helper.php on line 119
Warning: Undefined array key "dir" in /home/especiais/epsatisep/public_html/2020/EPS2020-wiki1/lib/plugins/wrap/helper.php on line 128
Warning: Undefined array key "lang" in /home/especiais/epsatisep/public_html/2020/EPS2020-wiki1/lib/plugins/wrap/helper.php on line 94
Warning: Undefined array key "id" in /home/especiais/epsatisep/public_html/2020/EPS2020-wiki1/lib/plugins/wrap/helper.php on line 117
Warning: Undefined array key "dir" in /home/especiais/epsatisep/public_html/2020/EPS2020-wiki1/lib/plugins/wrap/helper.php on line 128
Warning: Undefined array key "backlog" in /home/especiais/epsatisep/public_html/2020/EPS2020-wiki1/lib/plugins/caption/syntax/reference.php on line 75
Warning: Undefined array key "lang" in /home/especiais/epsatisep/public_html/2020/EPS2020-wiki1/lib/plugins/wrap/helper.php on line 94
Warning: Undefined array key "id" in /home/especiais/epsatisep/public_html/2020/EPS2020-wiki1/lib/plugins/wrap/helper.php on line 117
Warning: Undefined array key "width" in /home/especiais/epsatisep/public_html/2020/EPS2020-wiki1/lib/plugins/wrap/helper.php on line 119
Warning: Undefined array key "dir" in /home/especiais/epsatisep/public_html/2020/EPS2020-wiki1/lib/plugins/wrap/helper.php on line 128
Warning: Undefined array key "lang" in /home/especiais/epsatisep/public_html/2020/EPS2020-wiki1/lib/plugins/wrap/helper.php on line 94
Warning: Undefined array key "id" in /home/especiais/epsatisep/public_html/2020/EPS2020-wiki1/lib/plugins/wrap/helper.php on line 117
Warning: Undefined array key "dir" in /home/especiais/epsatisep/public_html/2020/EPS2020-wiki1/lib/plugins/wrap/helper.php on line 128
Warning: Undefined array key "sprintplans" in /home/especiais/epsatisep/public_html/2020/EPS2020-wiki1/lib/plugins/caption/syntax/reference.php on line 75
Warning: Undefined array key "lang" in /home/especiais/epsatisep/public_html/2020/EPS2020-wiki1/lib/plugins/wrap/helper.php on line 94
Warning: Undefined array key "id" in /home/especiais/epsatisep/public_html/2020/EPS2020-wiki1/lib/plugins/wrap/helper.php on line 117
Warning: Undefined array key "width" in /home/especiais/epsatisep/public_html/2020/EPS2020-wiki1/lib/plugins/wrap/helper.php on line 119
Warning: Undefined array key "dir" in /home/especiais/epsatisep/public_html/2020/EPS2020-wiki1/lib/plugins/wrap/helper.php on line 128
Warning: Undefined array key "lang" in /home/especiais/epsatisep/public_html/2020/EPS2020-wiki1/lib/plugins/wrap/helper.php on line 94
Warning: Undefined array key "id" in /home/especiais/epsatisep/public_html/2020/EPS2020-wiki1/lib/plugins/wrap/helper.php on line 117
Warning: Undefined array key "dir" in /home/especiais/epsatisep/public_html/2020/EPS2020-wiki1/lib/plugins/wrap/helper.php on line 128
Warning: Undefined array key "retrospectivetab" in /home/especiais/epsatisep/public_html/2020/EPS2020-wiki1/lib/plugins/caption/syntax/reference.php on line 75
Warning: Undefined array key "lang" in /home/especiais/epsatisep/public_html/2020/EPS2020-wiki1/lib/plugins/wrap/helper.php on line 94
Warning: Undefined array key "id" in /home/especiais/epsatisep/public_html/2020/EPS2020-wiki1/lib/plugins/wrap/helper.php on line 117
Warning: Undefined array key "width" in /home/especiais/epsatisep/public_html/2020/EPS2020-wiki1/lib/plugins/wrap/helper.php on line 119
Warning: Undefined array key "dir" in /home/especiais/epsatisep/public_html/2020/EPS2020-wiki1/lib/plugins/wrap/helper.php on line 128
Warning: Undefined array key "lang" in /home/especiais/epsatisep/public_html/2020/EPS2020-wiki1/lib/plugins/wrap/helper.php on line 94
Warning: Undefined array key "id" in /home/especiais/epsatisep/public_html/2020/EPS2020-wiki1/lib/plugins/wrap/helper.php on line 117
Warning: Undefined array key "dir" in /home/especiais/epsatisep/public_html/2020/EPS2020-wiki1/lib/plugins/wrap/helper.php on line 128
Warning: Undefined array key "marketinganalysis" in /home/especiais/epsatisep/public_html/2020/EPS2020-wiki1/lib/plugins/caption/syntax/reference.php on line 75
Warning: Undefined array key "lang" in /home/especiais/epsatisep/public_html/2020/EPS2020-wiki1/lib/plugins/wrap/helper.php on line 94
Warning: Undefined array key "id" in /home/especiais/epsatisep/public_html/2020/EPS2020-wiki1/lib/plugins/wrap/helper.php on line 117
Warning: Undefined array key "width" in /home/especiais/epsatisep/public_html/2020/EPS2020-wiki1/lib/plugins/wrap/helper.php on line 119
Warning: Undefined array key "dir" in /home/especiais/epsatisep/public_html/2020/EPS2020-wiki1/lib/plugins/wrap/helper.php on line 128
Warning: Undefined array key "lang" in /home/especiais/epsatisep/public_html/2020/EPS2020-wiki1/lib/plugins/wrap/helper.php on line 94
Warning: Undefined array key "id" in /home/especiais/epsatisep/public_html/2020/EPS2020-wiki1/lib/plugins/wrap/helper.php on line 117
Warning: Undefined array key "width" in /home/especiais/epsatisep/public_html/2020/EPS2020-wiki1/lib/plugins/wrap/helper.php on line 119
Warning: Undefined array key "dir" in /home/especiais/epsatisep/public_html/2020/EPS2020-wiki1/lib/plugins/wrap/helper.php on line 128
Warning: Undefined array key 1 in /home/especiais/epsatisep/public_html/2020/EPS2020-wiki1/lib/plugins/caption/syntax/caption.php on line 95
Warning: Undefined array key "competitivematrix" in /home/especiais/epsatisep/public_html/2020/EPS2020-wiki1/lib/plugins/caption/syntax/reference.php on line 75
Warning: Undefined array key "lang" in /home/especiais/epsatisep/public_html/2020/EPS2020-wiki1/lib/plugins/wrap/helper.php on line 94
Warning: Undefined array key "id" in /home/especiais/epsatisep/public_html/2020/EPS2020-wiki1/lib/plugins/wrap/helper.php on line 117
Warning: Undefined array key "dir" in /home/especiais/epsatisep/public_html/2020/EPS2020-wiki1/lib/plugins/wrap/helper.php on line 128
Warning: Undefined array key "lang" in /home/especiais/epsatisep/public_html/2020/EPS2020-wiki1/lib/plugins/wrap/helper.php on line 94
Warning: Undefined array key "id" in /home/especiais/epsatisep/public_html/2020/EPS2020-wiki1/lib/plugins/wrap/helper.php on line 117
Warning: Undefined array key "width" in /home/especiais/epsatisep/public_html/2020/EPS2020-wiki1/lib/plugins/wrap/helper.php on line 119
Warning: Undefined array key "dir" in /home/especiais/epsatisep/public_html/2020/EPS2020-wiki1/lib/plugins/wrap/helper.php on line 128
Warning: Undefined array key 1 in /home/especiais/epsatisep/public_html/2020/EPS2020-wiki1/lib/plugins/caption/syntax/caption.php on line 95
Warning: Undefined array key "productperceptualmap" in /home/especiais/epsatisep/public_html/2020/EPS2020-wiki1/lib/plugins/caption/syntax/reference.php on line 75
Warning: Undefined array key "lang" in /home/especiais/epsatisep/public_html/2020/EPS2020-wiki1/lib/plugins/wrap/helper.php on line 94
Warning: Undefined array key "id" in /home/especiais/epsatisep/public_html/2020/EPS2020-wiki1/lib/plugins/wrap/helper.php on line 117
Warning: Undefined array key "width" in /home/especiais/epsatisep/public_html/2020/EPS2020-wiki1/lib/plugins/wrap/helper.php on line 119
Warning: Undefined array key "dir" in /home/especiais/epsatisep/public_html/2020/EPS2020-wiki1/lib/plugins/wrap/helper.php on line 128
Warning: Undefined array key "comparisongreenprice" in /home/especiais/epsatisep/public_html/2020/EPS2020-wiki1/lib/plugins/caption/syntax/reference.php on line 75
Warning: Undefined array key "lang" in /home/especiais/epsatisep/public_html/2020/EPS2020-wiki1/lib/plugins/wrap/helper.php on line 94
Warning: Undefined array key "id" in /home/especiais/epsatisep/public_html/2020/EPS2020-wiki1/lib/plugins/wrap/helper.php on line 117
Warning: Undefined array key "width" in /home/especiais/epsatisep/public_html/2020/EPS2020-wiki1/lib/plugins/wrap/helper.php on line 119
Warning: Undefined array key "dir" in /home/especiais/epsatisep/public_html/2020/EPS2020-wiki1/lib/plugins/wrap/helper.php on line 128
Warning: Undefined array key "lang" in /home/especiais/epsatisep/public_html/2020/EPS2020-wiki1/lib/plugins/wrap/helper.php on line 94
Warning: Undefined array key "id" in /home/especiais/epsatisep/public_html/2020/EPS2020-wiki1/lib/plugins/wrap/helper.php on line 117
Warning: Undefined array key "dir" in /home/especiais/epsatisep/public_html/2020/EPS2020-wiki1/lib/plugins/wrap/helper.php on line 128
Warning: Undefined array key "soaksylogo" in /home/especiais/epsatisep/public_html/2020/EPS2020-wiki1/lib/plugins/caption/syntax/reference.php on line 75
Warning: Undefined array key "lang" in /home/especiais/epsatisep/public_html/2020/EPS2020-wiki1/lib/plugins/wrap/helper.php on line 94
Warning: Undefined array key "id" in /home/especiais/epsatisep/public_html/2020/EPS2020-wiki1/lib/plugins/wrap/helper.php on line 117
Warning: Undefined array key "width" in /home/especiais/epsatisep/public_html/2020/EPS2020-wiki1/lib/plugins/wrap/helper.php on line 119
Warning: Undefined array key "dir" in /home/especiais/epsatisep/public_html/2020/EPS2020-wiki1/lib/plugins/wrap/helper.php on line 128
Warning: Undefined array key "lang" in /home/especiais/epsatisep/public_html/2020/EPS2020-wiki1/lib/plugins/wrap/helper.php on line 94
Warning: Undefined array key "id" in /home/especiais/epsatisep/public_html/2020/EPS2020-wiki1/lib/plugins/wrap/helper.php on line 117
Warning: Undefined array key "width" in /home/especiais/epsatisep/public_html/2020/EPS2020-wiki1/lib/plugins/wrap/helper.php on line 119
Warning: Undefined array key "dir" in /home/especiais/epsatisep/public_html/2020/EPS2020-wiki1/lib/plugins/wrap/helper.php on line 128
Warning: Undefined array key "soaksydesign" in /home/especiais/epsatisep/public_html/2020/EPS2020-wiki1/lib/plugins/caption/syntax/reference.php on line 75
Warning: Undefined array key "lang" in /home/especiais/epsatisep/public_html/2020/EPS2020-wiki1/lib/plugins/wrap/helper.php on line 94
Warning: Undefined array key "id" in /home/especiais/epsatisep/public_html/2020/EPS2020-wiki1/lib/plugins/wrap/helper.php on line 117
Warning: Undefined array key "width" in /home/especiais/epsatisep/public_html/2020/EPS2020-wiki1/lib/plugins/wrap/helper.php on line 119
Warning: Undefined array key "dir" in /home/especiais/epsatisep/public_html/2020/EPS2020-wiki1/lib/plugins/wrap/helper.php on line 128
Warning: Undefined array key "budgetmarketing" in /home/especiais/epsatisep/public_html/2020/EPS2020-wiki1/lib/plugins/caption/syntax/reference.php on line 75
Warning: Undefined array key "lang" in /home/especiais/epsatisep/public_html/2020/EPS2020-wiki1/lib/plugins/wrap/helper.php on line 94
Warning: Undefined array key "id" in /home/especiais/epsatisep/public_html/2020/EPS2020-wiki1/lib/plugins/wrap/helper.php on line 117
Warning: Undefined array key "width" in /home/especiais/epsatisep/public_html/2020/EPS2020-wiki1/lib/plugins/wrap/helper.php on line 119
Warning: Undefined array key "dir" in /home/especiais/epsatisep/public_html/2020/EPS2020-wiki1/lib/plugins/wrap/helper.php on line 128
Warning: Undefined array key "lang" in /home/especiais/epsatisep/public_html/2020/EPS2020-wiki1/lib/plugins/wrap/helper.php on line 94
Warning: Undefined array key "id" in /home/especiais/epsatisep/public_html/2020/EPS2020-wiki1/lib/plugins/wrap/helper.php on line 117
Warning: Undefined array key "width" in /home/especiais/epsatisep/public_html/2020/EPS2020-wiki1/lib/plugins/wrap/helper.php on line 119
Warning: Undefined array key "dir" in /home/especiais/epsatisep/public_html/2020/EPS2020-wiki1/lib/plugins/wrap/helper.php on line 128
Warning: Undefined array key 1 in /home/especiais/epsatisep/public_html/2020/EPS2020-wiki1/lib/plugins/caption/syntax/caption.php on line 95
Warning: Undefined array key "lang" in /home/especiais/epsatisep/public_html/2020/EPS2020-wiki1/lib/plugins/wrap/helper.php on line 94
Warning: Undefined array key "id" in /home/especiais/epsatisep/public_html/2020/EPS2020-wiki1/lib/plugins/wrap/helper.php on line 117
Warning: Undefined array key "width" in /home/especiais/epsatisep/public_html/2020/EPS2020-wiki1/lib/plugins/wrap/helper.php on line 119
Warning: Undefined array key "dir" in /home/especiais/epsatisep/public_html/2020/EPS2020-wiki1/lib/plugins/wrap/helper.php on line 128
Warning: Undefined array key "life_cycle" in /home/especiais/epsatisep/public_html/2020/EPS2020-wiki1/lib/plugins/caption/syntax/reference.php on line 75
Warning: Undefined array key "lang" in /home/especiais/epsatisep/public_html/2020/EPS2020-wiki1/lib/plugins/wrap/helper.php on line 94
Warning: Undefined array key "id" in /home/especiais/epsatisep/public_html/2020/EPS2020-wiki1/lib/plugins/wrap/helper.php on line 117
Warning: Undefined array key "width" in /home/especiais/epsatisep/public_html/2020/EPS2020-wiki1/lib/plugins/wrap/helper.php on line 119
Warning: Undefined array key "dir" in /home/especiais/epsatisep/public_html/2020/EPS2020-wiki1/lib/plugins/wrap/helper.php on line 128
Warning: Undefined array key "fblackbox" in /home/especiais/epsatisep/public_html/2020/EPS2020-wiki1/lib/plugins/caption/syntax/reference.php on line 75
Warning: Undefined array key "lang" in /home/especiais/epsatisep/public_html/2020/EPS2020-wiki1/lib/plugins/wrap/helper.php on line 94
Warning: Undefined array key "id" in /home/especiais/epsatisep/public_html/2020/EPS2020-wiki1/lib/plugins/wrap/helper.php on line 117
Warning: Undefined array key "width" in /home/especiais/epsatisep/public_html/2020/EPS2020-wiki1/lib/plugins/wrap/helper.php on line 119
Warning: Undefined array key "dir" in /home/especiais/epsatisep/public_html/2020/EPS2020-wiki1/lib/plugins/wrap/helper.php on line 128
Warning: Undefined array key "ftechnical" in /home/especiais/epsatisep/public_html/2020/EPS2020-wiki1/lib/plugins/caption/syntax/reference.php on line 75
Warning: Undefined array key "lang" in /home/especiais/epsatisep/public_html/2020/EPS2020-wiki1/lib/plugins/wrap/helper.php on line 94
Warning: Undefined array key "id" in /home/especiais/epsatisep/public_html/2020/EPS2020-wiki1/lib/plugins/wrap/helper.php on line 117
Warning: Undefined array key "width" in /home/especiais/epsatisep/public_html/2020/EPS2020-wiki1/lib/plugins/wrap/helper.php on line 119
Warning: Undefined array key "dir" in /home/especiais/epsatisep/public_html/2020/EPS2020-wiki1/lib/plugins/wrap/helper.php on line 128
Warning: Undefined array key "fstructuraldrafts" in /home/especiais/epsatisep/public_html/2020/EPS2020-wiki1/lib/plugins/caption/syntax/reference.php on line 75
Warning: Undefined array key "lang" in /home/especiais/epsatisep/public_html/2020/EPS2020-wiki1/lib/plugins/wrap/helper.php on line 94
Warning: Undefined array key "id" in /home/especiais/epsatisep/public_html/2020/EPS2020-wiki1/lib/plugins/wrap/helper.php on line 117
Warning: Undefined array key "width" in /home/especiais/epsatisep/public_html/2020/EPS2020-wiki1/lib/plugins/wrap/helper.php on line 119
Warning: Undefined array key "dir" in /home/especiais/epsatisep/public_html/2020/EPS2020-wiki1/lib/plugins/wrap/helper.php on line 128
Warning: Undefined array key "3dmodel" in /home/especiais/epsatisep/public_html/2020/EPS2020-wiki1/lib/plugins/caption/syntax/reference.php on line 75
Warning: Undefined array key "lang" in /home/especiais/epsatisep/public_html/2020/EPS2020-wiki1/lib/plugins/wrap/helper.php on line 94
Warning: Undefined array key "id" in /home/especiais/epsatisep/public_html/2020/EPS2020-wiki1/lib/plugins/wrap/helper.php on line 117
Warning: Undefined array key "width" in /home/especiais/epsatisep/public_html/2020/EPS2020-wiki1/lib/plugins/wrap/helper.php on line 119
Warning: Undefined array key "dir" in /home/especiais/epsatisep/public_html/2020/EPS2020-wiki1/lib/plugins/wrap/helper.php on line 128
Warning: Undefined array key "felectric_schematics" in /home/especiais/epsatisep/public_html/2020/EPS2020-wiki1/lib/plugins/caption/syntax/reference.php on line 75
Warning: Undefined array key "lang" in /home/especiais/epsatisep/public_html/2020/EPS2020-wiki1/lib/plugins/wrap/helper.php on line 94
Warning: Undefined array key "id" in /home/especiais/epsatisep/public_html/2020/EPS2020-wiki1/lib/plugins/wrap/helper.php on line 117
Warning: Undefined array key "width" in /home/especiais/epsatisep/public_html/2020/EPS2020-wiki1/lib/plugins/wrap/helper.php on line 119
Warning: Undefined array key "dir" in /home/especiais/epsatisep/public_html/2020/EPS2020-wiki1/lib/plugins/wrap/helper.php on line 128
Warning: Undefined array key "materials" in /home/especiais/epsatisep/public_html/2020/EPS2020-wiki1/lib/plugins/caption/syntax/reference.php on line 75
Warning: Undefined array key "lang" in /home/especiais/epsatisep/public_html/2020/EPS2020-wiki1/lib/plugins/wrap/helper.php on line 94
Warning: Undefined array key "id" in /home/especiais/epsatisep/public_html/2020/EPS2020-wiki1/lib/plugins/wrap/helper.php on line 117
Warning: Undefined array key "width" in /home/especiais/epsatisep/public_html/2020/EPS2020-wiki1/lib/plugins/wrap/helper.php on line 119
Warning: Undefined array key "dir" in /home/especiais/epsatisep/public_html/2020/EPS2020-wiki1/lib/plugins/wrap/helper.php on line 128
Warning: Undefined array key "lang" in /home/especiais/epsatisep/public_html/2020/EPS2020-wiki1/lib/plugins/wrap/helper.php on line 94
Warning: Undefined array key "id" in /home/especiais/epsatisep/public_html/2020/EPS2020-wiki1/lib/plugins/wrap/helper.php on line 117
Warning: Undefined array key "dir" in /home/especiais/epsatisep/public_html/2020/EPS2020-wiki1/lib/plugins/wrap/helper.php on line 128
Warning: Undefined array key "componentpicture" in /home/especiais/epsatisep/public_html/2020/EPS2020-wiki1/lib/plugins/caption/syntax/reference.php on line 75
Warning: Undefined array key "lang" in /home/especiais/epsatisep/public_html/2020/EPS2020-wiki1/lib/plugins/wrap/helper.php on line 94
Warning: Undefined array key "id" in /home/especiais/epsatisep/public_html/2020/EPS2020-wiki1/lib/plugins/wrap/helper.php on line 117
Warning: Undefined array key "width" in /home/especiais/epsatisep/public_html/2020/EPS2020-wiki1/lib/plugins/wrap/helper.php on line 119
Warning: Undefined array key "dir" in /home/especiais/epsatisep/public_html/2020/EPS2020-wiki1/lib/plugins/wrap/helper.php on line 128
Warning: Undefined array key "lang" in /home/especiais/epsatisep/public_html/2020/EPS2020-wiki1/lib/plugins/wrap/helper.php on line 94
Warning: Undefined array key "id" in /home/especiais/epsatisep/public_html/2020/EPS2020-wiki1/lib/plugins/wrap/helper.php on line 117
Warning: Undefined array key "dir" in /home/especiais/epsatisep/public_html/2020/EPS2020-wiki1/lib/plugins/wrap/helper.php on line 128
Warning: Undefined array key "buycomponent" in /home/especiais/epsatisep/public_html/2020/EPS2020-wiki1/lib/plugins/caption/syntax/reference.php on line 75
Warning: Undefined array key "lang" in /home/especiais/epsatisep/public_html/2020/EPS2020-wiki1/lib/plugins/wrap/helper.php on line 94
Warning: Undefined array key "id" in /home/especiais/epsatisep/public_html/2020/EPS2020-wiki1/lib/plugins/wrap/helper.php on line 117
Warning: Undefined array key "width" in /home/especiais/epsatisep/public_html/2020/EPS2020-wiki1/lib/plugins/wrap/helper.php on line 119
Warning: Undefined array key "dir" in /home/especiais/epsatisep/public_html/2020/EPS2020-wiki1/lib/plugins/wrap/helper.php on line 128
Warning: Undefined array key "lang" in /home/especiais/epsatisep/public_html/2020/EPS2020-wiki1/lib/plugins/wrap/helper.php on line 94
Warning: Undefined array key "id" in /home/especiais/epsatisep/public_html/2020/EPS2020-wiki1/lib/plugins/wrap/helper.php on line 117
Warning: Undefined array key "dir" in /home/especiais/epsatisep/public_html/2020/EPS2020-wiki1/lib/plugins/wrap/helper.php on line 128
Warning: Undefined array key "pumpsdcac" in /home/especiais/epsatisep/public_html/2020/EPS2020-wiki1/lib/plugins/caption/syntax/reference.php on line 75
Warning: Undefined array key "lang" in /home/especiais/epsatisep/public_html/2020/EPS2020-wiki1/lib/plugins/wrap/helper.php on line 94
Warning: Undefined array key "id" in /home/especiais/epsatisep/public_html/2020/EPS2020-wiki1/lib/plugins/wrap/helper.php on line 117
Warning: Undefined array key "width" in /home/especiais/epsatisep/public_html/2020/EPS2020-wiki1/lib/plugins/wrap/helper.php on line 119
Warning: Undefined array key "dir" in /home/especiais/epsatisep/public_html/2020/EPS2020-wiki1/lib/plugins/wrap/helper.php on line 128
Warning: Undefined array key "lang" in /home/especiais/epsatisep/public_html/2020/EPS2020-wiki1/lib/plugins/wrap/helper.php on line 94
Warning: Undefined array key "id" in /home/especiais/epsatisep/public_html/2020/EPS2020-wiki1/lib/plugins/wrap/helper.php on line 117
Warning: Undefined array key "dir" in /home/especiais/epsatisep/public_html/2020/EPS2020-wiki1/lib/plugins/wrap/helper.php on line 128
Warning: Undefined array key "pumpssubsur" in /home/especiais/epsatisep/public_html/2020/EPS2020-wiki1/lib/plugins/caption/syntax/reference.php on line 75
Warning: Undefined array key "lang" in /home/especiais/epsatisep/public_html/2020/EPS2020-wiki1/lib/plugins/wrap/helper.php on line 94
Warning: Undefined array key "id" in /home/especiais/epsatisep/public_html/2020/EPS2020-wiki1/lib/plugins/wrap/helper.php on line 117
Warning: Undefined array key "width" in /home/especiais/epsatisep/public_html/2020/EPS2020-wiki1/lib/plugins/wrap/helper.php on line 119
Warning: Undefined array key "dir" in /home/especiais/epsatisep/public_html/2020/EPS2020-wiki1/lib/plugins/wrap/helper.php on line 128
Warning: Undefined array key "lang" in /home/especiais/epsatisep/public_html/2020/EPS2020-wiki1/lib/plugins/wrap/helper.php on line 94
Warning: Undefined array key "id" in /home/especiais/epsatisep/public_html/2020/EPS2020-wiki1/lib/plugins/wrap/helper.php on line 117
Warning: Undefined array key "dir" in /home/especiais/epsatisep/public_html/2020/EPS2020-wiki1/lib/plugins/wrap/helper.php on line 128
Warning: Undefined array key "pumpschoice" in /home/especiais/epsatisep/public_html/2020/EPS2020-wiki1/lib/plugins/caption/syntax/reference.php on line 75
Warning: Undefined array key "lang" in /home/especiais/epsatisep/public_html/2020/EPS2020-wiki1/lib/plugins/wrap/helper.php on line 94
Warning: Undefined array key "id" in /home/especiais/epsatisep/public_html/2020/EPS2020-wiki1/lib/plugins/wrap/helper.php on line 117
Warning: Undefined array key "width" in /home/especiais/epsatisep/public_html/2020/EPS2020-wiki1/lib/plugins/wrap/helper.php on line 119
Warning: Undefined array key "dir" in /home/especiais/epsatisep/public_html/2020/EPS2020-wiki1/lib/plugins/wrap/helper.php on line 128
Warning: Undefined array key "lang" in /home/especiais/epsatisep/public_html/2020/EPS2020-wiki1/lib/plugins/wrap/helper.php on line 94
Warning: Undefined array key "id" in /home/especiais/epsatisep/public_html/2020/EPS2020-wiki1/lib/plugins/wrap/helper.php on line 117
Warning: Undefined array key "dir" in /home/especiais/epsatisep/public_html/2020/EPS2020-wiki1/lib/plugins/wrap/helper.php on line 128
Warning: Undefined array key "lang" in /home/especiais/epsatisep/public_html/2020/EPS2020-wiki1/lib/plugins/wrap/helper.php on line 94
Warning: Undefined array key "id" in /home/especiais/epsatisep/public_html/2020/EPS2020-wiki1/lib/plugins/wrap/helper.php on line 117
Warning: Undefined array key "width" in /home/especiais/epsatisep/public_html/2020/EPS2020-wiki1/lib/plugins/wrap/helper.php on line 119
Warning: Undefined array key "dir" in /home/especiais/epsatisep/public_html/2020/EPS2020-wiki1/lib/plugins/wrap/helper.php on line 128
Warning: Undefined array key "lang" in /home/especiais/epsatisep/public_html/2020/EPS2020-wiki1/lib/plugins/wrap/helper.php on line 94
Warning: Undefined array key "id" in /home/especiais/epsatisep/public_html/2020/EPS2020-wiki1/lib/plugins/wrap/helper.php on line 117
Warning: Undefined array key "width" in /home/especiais/epsatisep/public_html/2020/EPS2020-wiki1/lib/plugins/wrap/helper.php on line 119
Warning: Undefined array key "dir" in /home/especiais/epsatisep/public_html/2020/EPS2020-wiki1/lib/plugins/wrap/helper.php on line 128
Warning: Undefined array key "sensortab" in /home/especiais/epsatisep/public_html/2020/EPS2020-wiki1/lib/plugins/caption/syntax/reference.php on line 75
Warning: Undefined array key "lang" in /home/especiais/epsatisep/public_html/2020/EPS2020-wiki1/lib/plugins/wrap/helper.php on line 94
Warning: Undefined array key "id" in /home/especiais/epsatisep/public_html/2020/EPS2020-wiki1/lib/plugins/wrap/helper.php on line 117
Warning: Undefined array key "width" in /home/especiais/epsatisep/public_html/2020/EPS2020-wiki1/lib/plugins/wrap/helper.php on line 119
Warning: Undefined array key "dir" in /home/especiais/epsatisep/public_html/2020/EPS2020-wiki1/lib/plugins/wrap/helper.php on line 128
Warning: Undefined array key "lang" in /home/especiais/epsatisep/public_html/2020/EPS2020-wiki1/lib/plugins/wrap/helper.php on line 94
Warning: Undefined array key "id" in /home/especiais/epsatisep/public_html/2020/EPS2020-wiki1/lib/plugins/wrap/helper.php on line 117
Warning: Undefined array key "width" in /home/especiais/epsatisep/public_html/2020/EPS2020-wiki1/lib/plugins/wrap/helper.php on line 119
Warning: Undefined array key "dir" in /home/especiais/epsatisep/public_html/2020/EPS2020-wiki1/lib/plugins/wrap/helper.php on line 128
Warning: Undefined array key "lang" in /home/especiais/epsatisep/public_html/2020/EPS2020-wiki1/lib/plugins/wrap/helper.php on line 94
Warning: Undefined array key "id" in /home/especiais/epsatisep/public_html/2020/EPS2020-wiki1/lib/plugins/wrap/helper.php on line 117
Warning: Undefined array key "width" in /home/especiais/epsatisep/public_html/2020/EPS2020-wiki1/lib/plugins/wrap/helper.php on line 119
Warning: Undefined array key "dir" in /home/especiais/epsatisep/public_html/2020/EPS2020-wiki1/lib/plugins/wrap/helper.php on line 128
Warning: Undefined array key "water_level" in /home/especiais/epsatisep/public_html/2020/EPS2020-wiki1/lib/plugins/caption/syntax/reference.php on line 75
Warning: Undefined array key "lang" in /home/especiais/epsatisep/public_html/2020/EPS2020-wiki1/lib/plugins/wrap/helper.php on line 94
Warning: Undefined array key "id" in /home/especiais/epsatisep/public_html/2020/EPS2020-wiki1/lib/plugins/wrap/helper.php on line 117
Warning: Undefined array key "width" in /home/especiais/epsatisep/public_html/2020/EPS2020-wiki1/lib/plugins/wrap/helper.php on line 119
Warning: Undefined array key "dir" in /home/especiais/epsatisep/public_html/2020/EPS2020-wiki1/lib/plugins/wrap/helper.php on line 128
Warning: Undefined array key "lang" in /home/especiais/epsatisep/public_html/2020/EPS2020-wiki1/lib/plugins/wrap/helper.php on line 94
Warning: Undefined array key "id" in /home/especiais/epsatisep/public_html/2020/EPS2020-wiki1/lib/plugins/wrap/helper.php on line 117
Warning: Undefined array key "width" in /home/especiais/epsatisep/public_html/2020/EPS2020-wiki1/lib/plugins/wrap/helper.php on line 119
Warning: Undefined array key "dir" in /home/especiais/epsatisep/public_html/2020/EPS2020-wiki1/lib/plugins/wrap/helper.php on line 128
Warning: Undefined array key "temperature_sensor" in /home/especiais/epsatisep/public_html/2020/EPS2020-wiki1/lib/plugins/caption/syntax/reference.php on line 75
Warning: Undefined array key "lang" in /home/especiais/epsatisep/public_html/2020/EPS2020-wiki1/lib/plugins/wrap/helper.php on line 94
Warning: Undefined array key "id" in /home/especiais/epsatisep/public_html/2020/EPS2020-wiki1/lib/plugins/wrap/helper.php on line 117
Warning: Undefined array key "width" in /home/especiais/epsatisep/public_html/2020/EPS2020-wiki1/lib/plugins/wrap/helper.php on line 119
Warning: Undefined array key "dir" in /home/especiais/epsatisep/public_html/2020/EPS2020-wiki1/lib/plugins/wrap/helper.php on line 128
Warning: Undefined array key "lang" in /home/especiais/epsatisep/public_html/2020/EPS2020-wiki1/lib/plugins/wrap/helper.php on line 94
Warning: Undefined array key "id" in /home/especiais/epsatisep/public_html/2020/EPS2020-wiki1/lib/plugins/wrap/helper.php on line 117
Warning: Undefined array key "width" in /home/especiais/epsatisep/public_html/2020/EPS2020-wiki1/lib/plugins/wrap/helper.php on line 119
Warning: Undefined array key "dir" in /home/especiais/epsatisep/public_html/2020/EPS2020-wiki1/lib/plugins/wrap/helper.php on line 128
Warning: Undefined array key "microprocessortab" in /home/especiais/epsatisep/public_html/2020/EPS2020-wiki1/lib/plugins/caption/syntax/reference.php on line 75
Warning: Undefined array key "lang" in /home/especiais/epsatisep/public_html/2020/EPS2020-wiki1/lib/plugins/wrap/helper.php on line 94
Warning: Undefined array key "id" in /home/especiais/epsatisep/public_html/2020/EPS2020-wiki1/lib/plugins/wrap/helper.php on line 117
Warning: Undefined array key "width" in /home/especiais/epsatisep/public_html/2020/EPS2020-wiki1/lib/plugins/wrap/helper.php on line 119
Warning: Undefined array key "dir" in /home/especiais/epsatisep/public_html/2020/EPS2020-wiki1/lib/plugins/wrap/helper.php on line 128
Warning: Undefined array key "lang" in /home/especiais/epsatisep/public_html/2020/EPS2020-wiki1/lib/plugins/wrap/helper.php on line 94
Warning: Undefined array key "id" in /home/especiais/epsatisep/public_html/2020/EPS2020-wiki1/lib/plugins/wrap/helper.php on line 117
Warning: Undefined array key "width" in /home/especiais/epsatisep/public_html/2020/EPS2020-wiki1/lib/plugins/wrap/helper.php on line 119
Warning: Undefined array key "dir" in /home/especiais/epsatisep/public_html/2020/EPS2020-wiki1/lib/plugins/wrap/helper.php on line 128
Warning: Undefined array key "llctab" in /home/especiais/epsatisep/public_html/2020/EPS2020-wiki1/lib/plugins/caption/syntax/reference.php on line 75
Warning: Undefined array key "lang" in /home/especiais/epsatisep/public_html/2020/EPS2020-wiki1/lib/plugins/wrap/helper.php on line 94
Warning: Undefined array key "id" in /home/especiais/epsatisep/public_html/2020/EPS2020-wiki1/lib/plugins/wrap/helper.php on line 117
Warning: Undefined array key "width" in /home/especiais/epsatisep/public_html/2020/EPS2020-wiki1/lib/plugins/wrap/helper.php on line 119
Warning: Undefined array key "dir" in /home/especiais/epsatisep/public_html/2020/EPS2020-wiki1/lib/plugins/wrap/helper.php on line 128
Warning: Undefined array key "lang" in /home/especiais/epsatisep/public_html/2020/EPS2020-wiki1/lib/plugins/wrap/helper.php on line 94
Warning: Undefined array key "id" in /home/especiais/epsatisep/public_html/2020/EPS2020-wiki1/lib/plugins/wrap/helper.php on line 117
Warning: Undefined array key "width" in /home/especiais/epsatisep/public_html/2020/EPS2020-wiki1/lib/plugins/wrap/helper.php on line 119
Warning: Undefined array key "dir" in /home/especiais/epsatisep/public_html/2020/EPS2020-wiki1/lib/plugins/wrap/helper.php on line 128
Warning: Undefined array key "mosfet" in /home/especiais/epsatisep/public_html/2020/EPS2020-wiki1/lib/plugins/caption/syntax/reference.php on line 75
Warning: Undefined array key "lang" in /home/especiais/epsatisep/public_html/2020/EPS2020-wiki1/lib/plugins/wrap/helper.php on line 94
Warning: Undefined array key "id" in /home/especiais/epsatisep/public_html/2020/EPS2020-wiki1/lib/plugins/wrap/helper.php on line 117
Warning: Undefined array key "width" in /home/especiais/epsatisep/public_html/2020/EPS2020-wiki1/lib/plugins/wrap/helper.php on line 119
Warning: Undefined array key "dir" in /home/especiais/epsatisep/public_html/2020/EPS2020-wiki1/lib/plugins/wrap/helper.php on line 128
Warning: Undefined array key "lang" in /home/especiais/epsatisep/public_html/2020/EPS2020-wiki1/lib/plugins/wrap/helper.php on line 94
Warning: Undefined array key "id" in /home/especiais/epsatisep/public_html/2020/EPS2020-wiki1/lib/plugins/wrap/helper.php on line 117
Warning: Undefined array key "width" in /home/especiais/epsatisep/public_html/2020/EPS2020-wiki1/lib/plugins/wrap/helper.php on line 119
Warning: Undefined array key "dir" in /home/especiais/epsatisep/public_html/2020/EPS2020-wiki1/lib/plugins/wrap/helper.php on line 128
Warning: Undefined array key "lang" in /home/especiais/epsatisep/public_html/2020/EPS2020-wiki1/lib/plugins/wrap/helper.php on line 94
Warning: Undefined array key "id" in /home/especiais/epsatisep/public_html/2020/EPS2020-wiki1/lib/plugins/wrap/helper.php on line 117
Warning: Undefined array key "width" in /home/especiais/epsatisep/public_html/2020/EPS2020-wiki1/lib/plugins/wrap/helper.php on line 119
Warning: Undefined array key "dir" in /home/especiais/epsatisep/public_html/2020/EPS2020-wiki1/lib/plugins/wrap/helper.php on line 128
Warning: Undefined array key "switch" in /home/especiais/epsatisep/public_html/2020/EPS2020-wiki1/lib/plugins/caption/syntax/reference.php on line 75
Warning: Undefined array key "lang" in /home/especiais/epsatisep/public_html/2020/EPS2020-wiki1/lib/plugins/wrap/helper.php on line 94
Warning: Undefined array key "id" in /home/especiais/epsatisep/public_html/2020/EPS2020-wiki1/lib/plugins/wrap/helper.php on line 117
Warning: Undefined array key "width" in /home/especiais/epsatisep/public_html/2020/EPS2020-wiki1/lib/plugins/wrap/helper.php on line 119
Warning: Undefined array key "dir" in /home/especiais/epsatisep/public_html/2020/EPS2020-wiki1/lib/plugins/wrap/helper.php on line 128
Warning: Undefined array key "lang" in /home/especiais/epsatisep/public_html/2020/EPS2020-wiki1/lib/plugins/wrap/helper.php on line 94
Warning: Undefined array key "id" in /home/especiais/epsatisep/public_html/2020/EPS2020-wiki1/lib/plugins/wrap/helper.php on line 117
Warning: Undefined array key "width" in /home/especiais/epsatisep/public_html/2020/EPS2020-wiki1/lib/plugins/wrap/helper.php on line 119
Warning: Undefined array key "dir" in /home/especiais/epsatisep/public_html/2020/EPS2020-wiki1/lib/plugins/wrap/helper.php on line 128
Warning: Undefined array key "12335dcdctab" in /home/especiais/epsatisep/public_html/2020/EPS2020-wiki1/lib/plugins/caption/syntax/reference.php on line 75
Warning: Undefined array key "lang" in /home/especiais/epsatisep/public_html/2020/EPS2020-wiki1/lib/plugins/wrap/helper.php on line 94
Warning: Undefined array key "id" in /home/especiais/epsatisep/public_html/2020/EPS2020-wiki1/lib/plugins/wrap/helper.php on line 117
Warning: Undefined array key "width" in /home/especiais/epsatisep/public_html/2020/EPS2020-wiki1/lib/plugins/wrap/helper.php on line 119
Warning: Undefined array key "dir" in /home/especiais/epsatisep/public_html/2020/EPS2020-wiki1/lib/plugins/wrap/helper.php on line 128
Warning: Undefined array key "lang" in /home/especiais/epsatisep/public_html/2020/EPS2020-wiki1/lib/plugins/wrap/helper.php on line 94
Warning: Undefined array key "id" in /home/especiais/epsatisep/public_html/2020/EPS2020-wiki1/lib/plugins/wrap/helper.php on line 117
Warning: Undefined array key "width" in /home/especiais/epsatisep/public_html/2020/EPS2020-wiki1/lib/plugins/wrap/helper.php on line 119
Warning: Undefined array key "dir" in /home/especiais/epsatisep/public_html/2020/EPS2020-wiki1/lib/plugins/wrap/helper.php on line 128
Warning: Undefined array key "lang" in /home/especiais/epsatisep/public_html/2020/EPS2020-wiki1/lib/plugins/wrap/helper.php on line 94
Warning: Undefined array key "id" in /home/especiais/epsatisep/public_html/2020/EPS2020-wiki1/lib/plugins/wrap/helper.php on line 117
Warning: Undefined array key "width" in /home/especiais/epsatisep/public_html/2020/EPS2020-wiki1/lib/plugins/wrap/helper.php on line 119
Warning: Undefined array key "dir" in /home/especiais/epsatisep/public_html/2020/EPS2020-wiki1/lib/plugins/wrap/helper.php on line 128
Warning: Undefined array key "wiv12tab" in /home/especiais/epsatisep/public_html/2020/EPS2020-wiki1/lib/plugins/caption/syntax/reference.php on line 75
Warning: Undefined array key "lang" in /home/especiais/epsatisep/public_html/2020/EPS2020-wiki1/lib/plugins/wrap/helper.php on line 94
Warning: Undefined array key "id" in /home/especiais/epsatisep/public_html/2020/EPS2020-wiki1/lib/plugins/wrap/helper.php on line 117
Warning: Undefined array key "width" in /home/especiais/epsatisep/public_html/2020/EPS2020-wiki1/lib/plugins/wrap/helper.php on line 119
Warning: Undefined array key "dir" in /home/especiais/epsatisep/public_html/2020/EPS2020-wiki1/lib/plugins/wrap/helper.php on line 128
Warning: Undefined array key "lang" in /home/especiais/epsatisep/public_html/2020/EPS2020-wiki1/lib/plugins/wrap/helper.php on line 94
Warning: Undefined array key "id" in /home/especiais/epsatisep/public_html/2020/EPS2020-wiki1/lib/plugins/wrap/helper.php on line 117
Warning: Undefined array key "width" in /home/especiais/epsatisep/public_html/2020/EPS2020-wiki1/lib/plugins/wrap/helper.php on line 119
Warning: Undefined array key "dir" in /home/especiais/epsatisep/public_html/2020/EPS2020-wiki1/lib/plugins/wrap/helper.php on line 128
Warning: Undefined array key "lang" in /home/especiais/epsatisep/public_html/2020/EPS2020-wiki1/lib/plugins/wrap/helper.php on line 94
Warning: Undefined array key "id" in /home/especiais/epsatisep/public_html/2020/EPS2020-wiki1/lib/plugins/wrap/helper.php on line 117
Warning: Undefined array key "width" in /home/especiais/epsatisep/public_html/2020/EPS2020-wiki1/lib/plugins/wrap/helper.php on line 119
Warning: Undefined array key "dir" in /home/especiais/epsatisep/public_html/2020/EPS2020-wiki1/lib/plugins/wrap/helper.php on line 128
Warning: Undefined array key "diodetab" in /home/especiais/epsatisep/public_html/2020/EPS2020-wiki1/lib/plugins/caption/syntax/reference.php on line 75
Warning: Undefined array key "lang" in /home/especiais/epsatisep/public_html/2020/EPS2020-wiki1/lib/plugins/wrap/helper.php on line 94
Warning: Undefined array key "id" in /home/especiais/epsatisep/public_html/2020/EPS2020-wiki1/lib/plugins/wrap/helper.php on line 117
Warning: Undefined array key "width" in /home/especiais/epsatisep/public_html/2020/EPS2020-wiki1/lib/plugins/wrap/helper.php on line 119
Warning: Undefined array key "dir" in /home/especiais/epsatisep/public_html/2020/EPS2020-wiki1/lib/plugins/wrap/helper.php on line 128
Warning: Undefined array key "lang" in /home/especiais/epsatisep/public_html/2020/EPS2020-wiki1/lib/plugins/wrap/helper.php on line 94
Warning: Undefined array key "id" in /home/especiais/epsatisep/public_html/2020/EPS2020-wiki1/lib/plugins/wrap/helper.php on line 117
Warning: Undefined array key "width" in /home/especiais/epsatisep/public_html/2020/EPS2020-wiki1/lib/plugins/wrap/helper.php on line 119
Warning: Undefined array key "dir" in /home/especiais/epsatisep/public_html/2020/EPS2020-wiki1/lib/plugins/wrap/helper.php on line 128
Warning: Undefined array key "lang" in /home/especiais/epsatisep/public_html/2020/EPS2020-wiki1/lib/plugins/wrap/helper.php on line 94
Warning: Undefined array key "id" in /home/especiais/epsatisep/public_html/2020/EPS2020-wiki1/lib/plugins/wrap/helper.php on line 117
Warning: Undefined array key "width" in /home/especiais/epsatisep/public_html/2020/EPS2020-wiki1/lib/plugins/wrap/helper.php on line 119
Warning: Undefined array key "dir" in /home/especiais/epsatisep/public_html/2020/EPS2020-wiki1/lib/plugins/wrap/helper.php on line 128
Warning: Undefined array key "powersupplytab" in /home/especiais/epsatisep/public_html/2020/EPS2020-wiki1/lib/plugins/caption/syntax/reference.php on line 75
Warning: Undefined array key "lang" in /home/especiais/epsatisep/public_html/2020/EPS2020-wiki1/lib/plugins/wrap/helper.php on line 94
Warning: Undefined array key "id" in /home/especiais/epsatisep/public_html/2020/EPS2020-wiki1/lib/plugins/wrap/helper.php on line 117
Warning: Undefined array key "width" in /home/especiais/epsatisep/public_html/2020/EPS2020-wiki1/lib/plugins/wrap/helper.php on line 119
Warning: Undefined array key "dir" in /home/especiais/epsatisep/public_html/2020/EPS2020-wiki1/lib/plugins/wrap/helper.php on line 128
Warning: Undefined array key "lang" in /home/especiais/epsatisep/public_html/2020/EPS2020-wiki1/lib/plugins/wrap/helper.php on line 94
Warning: Undefined array key "id" in /home/especiais/epsatisep/public_html/2020/EPS2020-wiki1/lib/plugins/wrap/helper.php on line 117
Warning: Undefined array key "width" in /home/especiais/epsatisep/public_html/2020/EPS2020-wiki1/lib/plugins/wrap/helper.php on line 119
Warning: Undefined array key "dir" in /home/especiais/epsatisep/public_html/2020/EPS2020-wiki1/lib/plugins/wrap/helper.php on line 128
Warning: Undefined array key "lang" in /home/especiais/epsatisep/public_html/2020/EPS2020-wiki1/lib/plugins/wrap/helper.php on line 94
Warning: Undefined array key "id" in /home/especiais/epsatisep/public_html/2020/EPS2020-wiki1/lib/plugins/wrap/helper.php on line 117
Warning: Undefined array key "width" in /home/especiais/epsatisep/public_html/2020/EPS2020-wiki1/lib/plugins/wrap/helper.php on line 119
Warning: Undefined array key "dir" in /home/especiais/epsatisep/public_html/2020/EPS2020-wiki1/lib/plugins/wrap/helper.php on line 128
Warning: Undefined array key "photovoltaictab" in /home/especiais/epsatisep/public_html/2020/EPS2020-wiki1/lib/plugins/caption/syntax/reference.php on line 75
Warning: Undefined array key "lang" in /home/especiais/epsatisep/public_html/2020/EPS2020-wiki1/lib/plugins/wrap/helper.php on line 94
Warning: Undefined array key "id" in /home/especiais/epsatisep/public_html/2020/EPS2020-wiki1/lib/plugins/wrap/helper.php on line 117
Warning: Undefined array key "width" in /home/especiais/epsatisep/public_html/2020/EPS2020-wiki1/lib/plugins/wrap/helper.php on line 119
Warning: Undefined array key "dir" in /home/especiais/epsatisep/public_html/2020/EPS2020-wiki1/lib/plugins/wrap/helper.php on line 128
Warning: Undefined array key "lang" in /home/especiais/epsatisep/public_html/2020/EPS2020-wiki1/lib/plugins/wrap/helper.php on line 94
Warning: Undefined array key "id" in /home/especiais/epsatisep/public_html/2020/EPS2020-wiki1/lib/plugins/wrap/helper.php on line 117
Warning: Undefined array key "dir" in /home/especiais/epsatisep/public_html/2020/EPS2020-wiki1/lib/plugins/wrap/helper.php on line 128
Warning: Undefined array key "photovoltaicprototab" in /home/especiais/epsatisep/public_html/2020/EPS2020-wiki1/lib/plugins/caption/syntax/reference.php on line 75
Warning: Undefined array key "lang" in /home/especiais/epsatisep/public_html/2020/EPS2020-wiki1/lib/plugins/wrap/helper.php on line 94
Warning: Undefined array key "id" in /home/especiais/epsatisep/public_html/2020/EPS2020-wiki1/lib/plugins/wrap/helper.php on line 117
Warning: Undefined array key "width" in /home/especiais/epsatisep/public_html/2020/EPS2020-wiki1/lib/plugins/wrap/helper.php on line 119
Warning: Undefined array key "dir" in /home/especiais/epsatisep/public_html/2020/EPS2020-wiki1/lib/plugins/wrap/helper.php on line 128
Warning: Undefined array key "lang" in /home/especiais/epsatisep/public_html/2020/EPS2020-wiki1/lib/plugins/wrap/helper.php on line 94
Warning: Undefined array key "id" in /home/especiais/epsatisep/public_html/2020/EPS2020-wiki1/lib/plugins/wrap/helper.php on line 117
Warning: Undefined array key "dir" in /home/especiais/epsatisep/public_html/2020/EPS2020-wiki1/lib/plugins/wrap/helper.php on line 128
Warning: Undefined array key "lang" in /home/especiais/epsatisep/public_html/2020/EPS2020-wiki1/lib/plugins/wrap/helper.php on line 94
Warning: Undefined array key "id" in /home/especiais/epsatisep/public_html/2020/EPS2020-wiki1/lib/plugins/wrap/helper.php on line 117
Warning: Undefined array key "width" in /home/especiais/epsatisep/public_html/2020/EPS2020-wiki1/lib/plugins/wrap/helper.php on line 119
Warning: Undefined array key "dir" in /home/especiais/epsatisep/public_html/2020/EPS2020-wiki1/lib/plugins/wrap/helper.php on line 128
Warning: Undefined array key "lang" in /home/especiais/epsatisep/public_html/2020/EPS2020-wiki1/lib/plugins/wrap/helper.php on line 94
Warning: Undefined array key "id" in /home/especiais/epsatisep/public_html/2020/EPS2020-wiki1/lib/plugins/wrap/helper.php on line 117
Warning: Undefined array key "width" in /home/especiais/epsatisep/public_html/2020/EPS2020-wiki1/lib/plugins/wrap/helper.php on line 119
Warning: Undefined array key "dir" in /home/especiais/epsatisep/public_html/2020/EPS2020-wiki1/lib/plugins/wrap/helper.php on line 128
Warning: Undefined array key "deliveryfees" in /home/especiais/epsatisep/public_html/2020/EPS2020-wiki1/lib/plugins/caption/syntax/reference.php on line 75
Warning: Undefined array key "lang" in /home/especiais/epsatisep/public_html/2020/EPS2020-wiki1/lib/plugins/wrap/helper.php on line 94
Warning: Undefined array key "id" in /home/especiais/epsatisep/public_html/2020/EPS2020-wiki1/lib/plugins/wrap/helper.php on line 117
Warning: Undefined array key "width" in /home/especiais/epsatisep/public_html/2020/EPS2020-wiki1/lib/plugins/wrap/helper.php on line 119
Warning: Undefined array key "dir" in /home/especiais/epsatisep/public_html/2020/EPS2020-wiki1/lib/plugins/wrap/helper.php on line 128
Warning: Undefined array key "lang" in /home/especiais/epsatisep/public_html/2020/EPS2020-wiki1/lib/plugins/wrap/helper.php on line 94
Warning: Undefined array key "id" in /home/especiais/epsatisep/public_html/2020/EPS2020-wiki1/lib/plugins/wrap/helper.php on line 117
Warning: Undefined array key "dir" in /home/especiais/epsatisep/public_html/2020/EPS2020-wiki1/lib/plugins/wrap/helper.php on line 128
Warning: Undefined array key "birdrepellers" in /home/especiais/epsatisep/public_html/2020/EPS2020-wiki1/lib/plugins/caption/syntax/reference.php on line 75
Warning: Undefined array key "lang" in /home/especiais/epsatisep/public_html/2020/EPS2020-wiki1/lib/plugins/wrap/helper.php on line 94
Warning: Undefined array key "id" in /home/especiais/epsatisep/public_html/2020/EPS2020-wiki1/lib/plugins/wrap/helper.php on line 117
Warning: Undefined array key "width" in /home/especiais/epsatisep/public_html/2020/EPS2020-wiki1/lib/plugins/wrap/helper.php on line 119
Warning: Undefined array key "dir" in /home/especiais/epsatisep/public_html/2020/EPS2020-wiki1/lib/plugins/wrap/helper.php on line 128
Warning: Undefined array key "lang" in /home/especiais/epsatisep/public_html/2020/EPS2020-wiki1/lib/plugins/wrap/helper.php on line 94
Warning: Undefined array key "id" in /home/especiais/epsatisep/public_html/2020/EPS2020-wiki1/lib/plugins/wrap/helper.php on line 117
Warning: Undefined array key "dir" in /home/especiais/epsatisep/public_html/2020/EPS2020-wiki1/lib/plugins/wrap/helper.php on line 128
Warning: Undefined array key "lang" in /home/especiais/epsatisep/public_html/2020/EPS2020-wiki1/lib/plugins/wrap/helper.php on line 94
Warning: Undefined array key "id" in /home/especiais/epsatisep/public_html/2020/EPS2020-wiki1/lib/plugins/wrap/helper.php on line 117
Warning: Undefined array key "width" in /home/especiais/epsatisep/public_html/2020/EPS2020-wiki1/lib/plugins/wrap/helper.php on line 119
Warning: Undefined array key "dir" in /home/especiais/epsatisep/public_html/2020/EPS2020-wiki1/lib/plugins/wrap/helper.php on line 128
Warning: Undefined array key "lang" in /home/especiais/epsatisep/public_html/2020/EPS2020-wiki1/lib/plugins/wrap/helper.php on line 94
Warning: Undefined array key "id" in /home/especiais/epsatisep/public_html/2020/EPS2020-wiki1/lib/plugins/wrap/helper.php on line 117
Warning: Undefined array key "width" in /home/especiais/epsatisep/public_html/2020/EPS2020-wiki1/lib/plugins/wrap/helper.php on line 119
Warning: Undefined array key "dir" in /home/especiais/epsatisep/public_html/2020/EPS2020-wiki1/lib/plugins/wrap/helper.php on line 128
Warning: Undefined array key "listofmaterials" in /home/especiais/epsatisep/public_html/2020/EPS2020-wiki1/lib/plugins/caption/syntax/reference.php on line 75
Warning: Undefined array key "lang" in /home/especiais/epsatisep/public_html/2020/EPS2020-wiki1/lib/plugins/wrap/helper.php on line 94
Warning: Undefined array key "id" in /home/especiais/epsatisep/public_html/2020/EPS2020-wiki1/lib/plugins/wrap/helper.php on line 117
Warning: Undefined array key "width" in /home/especiais/epsatisep/public_html/2020/EPS2020-wiki1/lib/plugins/wrap/helper.php on line 119
Warning: Undefined array key "dir" in /home/especiais/epsatisep/public_html/2020/EPS2020-wiki1/lib/plugins/wrap/helper.php on line 128
Warning: Undefined array key "lang" in /home/especiais/epsatisep/public_html/2020/EPS2020-wiki1/lib/plugins/wrap/helper.php on line 94
Warning: Undefined array key "id" in /home/especiais/epsatisep/public_html/2020/EPS2020-wiki1/lib/plugins/wrap/helper.php on line 117
Warning: Undefined array key "dir" in /home/especiais/epsatisep/public_html/2020/EPS2020-wiki1/lib/plugins/wrap/helper.php on line 128
Warning: Undefined array key "powerloads" in /home/especiais/epsatisep/public_html/2020/EPS2020-wiki1/lib/plugins/caption/syntax/reference.php on line 75
Warning: Undefined array key "lang" in /home/especiais/epsatisep/public_html/2020/EPS2020-wiki1/lib/plugins/wrap/helper.php on line 94
Warning: Undefined array key "id" in /home/especiais/epsatisep/public_html/2020/EPS2020-wiki1/lib/plugins/wrap/helper.php on line 117
Warning: Undefined array key "width" in /home/especiais/epsatisep/public_html/2020/EPS2020-wiki1/lib/plugins/wrap/helper.php on line 119
Warning: Undefined array key "dir" in /home/especiais/epsatisep/public_html/2020/EPS2020-wiki1/lib/plugins/wrap/helper.php on line 128
Warning: Undefined array key "lang" in /home/especiais/epsatisep/public_html/2020/EPS2020-wiki1/lib/plugins/wrap/helper.php on line 94
Warning: Undefined array key "id" in /home/especiais/epsatisep/public_html/2020/EPS2020-wiki1/lib/plugins/wrap/helper.php on line 117
Warning: Undefined array key "dir" in /home/especiais/epsatisep/public_html/2020/EPS2020-wiki1/lib/plugins/wrap/helper.php on line 128
Warning: Undefined array key "powerdist" in /home/especiais/epsatisep/public_html/2020/EPS2020-wiki1/lib/plugins/caption/syntax/reference.php on line 75
Warning: Undefined array key "lang" in /home/especiais/epsatisep/public_html/2020/EPS2020-wiki1/lib/plugins/wrap/helper.php on line 94
Warning: Undefined array key "id" in /home/especiais/epsatisep/public_html/2020/EPS2020-wiki1/lib/plugins/wrap/helper.php on line 117
Warning: Undefined array key "width" in /home/especiais/epsatisep/public_html/2020/EPS2020-wiki1/lib/plugins/wrap/helper.php on line 119
Warning: Undefined array key "dir" in /home/especiais/epsatisep/public_html/2020/EPS2020-wiki1/lib/plugins/wrap/helper.php on line 128
Warning: Undefined array key "lang" in /home/especiais/epsatisep/public_html/2020/EPS2020-wiki1/lib/plugins/wrap/helper.php on line 94
Warning: Undefined array key "id" in /home/especiais/epsatisep/public_html/2020/EPS2020-wiki1/lib/plugins/wrap/helper.php on line 117
Warning: Undefined array key "dir" in /home/especiais/epsatisep/public_html/2020/EPS2020-wiki1/lib/plugins/wrap/helper.php on line 128
Warning: Undefined array key "powersrc" in /home/especiais/epsatisep/public_html/2020/EPS2020-wiki1/lib/plugins/caption/syntax/reference.php on line 75
Warning: Undefined array key "lang" in /home/especiais/epsatisep/public_html/2020/EPS2020-wiki1/lib/plugins/wrap/helper.php on line 94
Warning: Undefined array key "id" in /home/especiais/epsatisep/public_html/2020/EPS2020-wiki1/lib/plugins/wrap/helper.php on line 117
Warning: Undefined array key "width" in /home/especiais/epsatisep/public_html/2020/EPS2020-wiki1/lib/plugins/wrap/helper.php on line 119
Warning: Undefined array key "dir" in /home/especiais/epsatisep/public_html/2020/EPS2020-wiki1/lib/plugins/wrap/helper.php on line 128
Warning: Undefined array key "lang" in /home/especiais/epsatisep/public_html/2020/EPS2020-wiki1/lib/plugins/wrap/helper.php on line 94
Warning: Undefined array key "id" in /home/especiais/epsatisep/public_html/2020/EPS2020-wiki1/lib/plugins/wrap/helper.php on line 117
Warning: Undefined array key "dir" in /home/especiais/epsatisep/public_html/2020/EPS2020-wiki1/lib/plugins/wrap/helper.php on line 128
Warning: Undefined array key "waterlevel" in /home/especiais/epsatisep/public_html/2020/EPS2020-wiki1/lib/plugins/caption/syntax/reference.php on line 75
Warning: Undefined array key "lang" in /home/especiais/epsatisep/public_html/2020/EPS2020-wiki1/lib/plugins/wrap/helper.php on line 94
Warning: Undefined array key "id" in /home/especiais/epsatisep/public_html/2020/EPS2020-wiki1/lib/plugins/wrap/helper.php on line 117
Warning: Undefined array key "width" in /home/especiais/epsatisep/public_html/2020/EPS2020-wiki1/lib/plugins/wrap/helper.php on line 119
Warning: Undefined array key "dir" in /home/especiais/epsatisep/public_html/2020/EPS2020-wiki1/lib/plugins/wrap/helper.php on line 128
Warning: Undefined array key "dashboard" in /home/especiais/epsatisep/public_html/2020/EPS2020-wiki1/lib/plugins/caption/syntax/reference.php on line 75
Warning: Undefined array key "lang" in /home/especiais/epsatisep/public_html/2020/EPS2020-wiki1/lib/plugins/wrap/helper.php on line 94
Warning: Undefined array key "id" in /home/especiais/epsatisep/public_html/2020/EPS2020-wiki1/lib/plugins/wrap/helper.php on line 117
Warning: Undefined array key "width" in /home/especiais/epsatisep/public_html/2020/EPS2020-wiki1/lib/plugins/wrap/helper.php on line 119
Warning: Undefined array key "dir" in /home/especiais/epsatisep/public_html/2020/EPS2020-wiki1/lib/plugins/wrap/helper.php on line 128
Warning: Undefined array key "control_circuit" in /home/especiais/epsatisep/public_html/2020/EPS2020-wiki1/lib/plugins/caption/syntax/reference.php on line 75
Warning: Undefined array key "lang" in /home/especiais/epsatisep/public_html/2020/EPS2020-wiki1/lib/plugins/wrap/helper.php on line 94
Warning: Undefined array key "id" in /home/especiais/epsatisep/public_html/2020/EPS2020-wiki1/lib/plugins/wrap/helper.php on line 117
Warning: Undefined array key "width" in /home/especiais/epsatisep/public_html/2020/EPS2020-wiki1/lib/plugins/wrap/helper.php on line 119
Warning: Undefined array key "dir" in /home/especiais/epsatisep/public_html/2020/EPS2020-wiki1/lib/plugins/wrap/helper.php on line 128
Warning: Undefined array key "volt_reg" in /home/especiais/epsatisep/public_html/2020/EPS2020-wiki1/lib/plugins/caption/syntax/reference.php on line 75
Warning: Undefined array key "lang" in /home/especiais/epsatisep/public_html/2020/EPS2020-wiki1/lib/plugins/wrap/helper.php on line 94
Warning: Undefined array key "id" in /home/especiais/epsatisep/public_html/2020/EPS2020-wiki1/lib/plugins/wrap/helper.php on line 117
Warning: Undefined array key "width" in /home/especiais/epsatisep/public_html/2020/EPS2020-wiki1/lib/plugins/wrap/helper.php on line 119
Warning: Undefined array key "dir" in /home/especiais/epsatisep/public_html/2020/EPS2020-wiki1/lib/plugins/wrap/helper.php on line 128
Warning: Undefined array key "safetyout" in /home/especiais/epsatisep/public_html/2020/EPS2020-wiki1/lib/plugins/caption/syntax/reference.php on line 75
Warning: Undefined array key "lang" in /home/especiais/epsatisep/public_html/2020/EPS2020-wiki1/lib/plugins/wrap/helper.php on line 94
Warning: Undefined array key "id" in /home/especiais/epsatisep/public_html/2020/EPS2020-wiki1/lib/plugins/wrap/helper.php on line 117
Warning: Undefined array key "width" in /home/especiais/epsatisep/public_html/2020/EPS2020-wiki1/lib/plugins/wrap/helper.php on line 119
Warning: Undefined array key "dir" in /home/especiais/epsatisep/public_html/2020/EPS2020-wiki1/lib/plugins/wrap/helper.php on line 128
Warning: Undefined array key "stressout" in /home/especiais/epsatisep/public_html/2020/EPS2020-wiki1/lib/plugins/caption/syntax/reference.php on line 75
Warning: Undefined array key "lang" in /home/especiais/epsatisep/public_html/2020/EPS2020-wiki1/lib/plugins/wrap/helper.php on line 94
Warning: Undefined array key "id" in /home/especiais/epsatisep/public_html/2020/EPS2020-wiki1/lib/plugins/wrap/helper.php on line 117
Warning: Undefined array key "width" in /home/especiais/epsatisep/public_html/2020/EPS2020-wiki1/lib/plugins/wrap/helper.php on line 119
Warning: Undefined array key "dir" in /home/especiais/epsatisep/public_html/2020/EPS2020-wiki1/lib/plugins/wrap/helper.php on line 128
Warning: Undefined array key "safetyin" in /home/especiais/epsatisep/public_html/2020/EPS2020-wiki1/lib/plugins/caption/syntax/reference.php on line 75
Warning: Undefined array key "lang" in /home/especiais/epsatisep/public_html/2020/EPS2020-wiki1/lib/plugins/wrap/helper.php on line 94
Warning: Undefined array key "id" in /home/especiais/epsatisep/public_html/2020/EPS2020-wiki1/lib/plugins/wrap/helper.php on line 117
Warning: Undefined array key "width" in /home/especiais/epsatisep/public_html/2020/EPS2020-wiki1/lib/plugins/wrap/helper.php on line 119
Warning: Undefined array key "dir" in /home/especiais/epsatisep/public_html/2020/EPS2020-wiki1/lib/plugins/wrap/helper.php on line 128
Warning: Undefined array key "stressin" in /home/especiais/epsatisep/public_html/2020/EPS2020-wiki1/lib/plugins/caption/syntax/reference.php on line 75
Warning: Undefined array key "lang" in /home/especiais/epsatisep/public_html/2020/EPS2020-wiki1/lib/plugins/wrap/helper.php on line 94
Warning: Undefined array key "id" in /home/especiais/epsatisep/public_html/2020/EPS2020-wiki1/lib/plugins/wrap/helper.php on line 117
Warning: Undefined array key "width" in /home/especiais/epsatisep/public_html/2020/EPS2020-wiki1/lib/plugins/wrap/helper.php on line 119
Warning: Undefined array key "dir" in /home/especiais/epsatisep/public_html/2020/EPS2020-wiki1/lib/plugins/wrap/helper.php on line 128
Table of Contents
Report
![]()
Title
Floating Trash Collector
Authors:
- António Santos
- Bianca Serafia
- Davide Caddia
- Evelien Zeeman
- Laura Castañer
- Patrick Jørgensen (left project group on 11.03.2020)
Acknowledgement
Glossary
| Abbreviation | Description |
|---|---|
| AC | Alternating current |
| bps | bits per second |
| CO2 | Carbon Dioxide |
| CSR | Corporate Sustainability Responsibility |
| DC | Direct current |
| DO | Dissolved Oxygen |
| EMS | Environmental Management System |
| EPS | European Project Semester |
| FAQ | Frequently Asked Questions |
| FET | Field Effect Transistor |
| HDPE | High-density polyethylene |
| IC | Integrated circuit |
| i.e. | id est / that is |
| IoT | Internet of Things |
| ISEP | Instituto Superior de Engenharia do Porto |
| l/hour | Liters per hour |
| LED | Light emitting diode |
| Mbps | Megabit per second |
| MCU | Microcontroller unit |
| MOSFET | Metal Oxide Semiconductor Field Effect Transistor |
| MPa | Megapascals |
| N | Newtons |
| NPO | Nonprofit organization |
| NSPE | National Society of Professional Engineers |
| ORP | Oxidation-Reduction Potential |
| PA | Polyamide |
| PBI | Project Backlog Item |
| PE | Polyethylene |
| PET | Polyethylene Terephthalate |
| PEST | Political, Economical, Social and Technological |
| PESTLE | Political, Economical, Social, Technological, Legal and Environmental |
| PMMA | Polymethyl Methacrylate |
| PP | Polypropylene |
| PU | Polyurethane |
| PWM | Pulse Width Modulation |
| SWOT | Strengths, Weaknesses, Opportunities, and Threats |
| TPU | Thermoplastic polyurethane |
| WBCSD | World Business Council for Sustainable Development |
| WBS | Work Breakdown Structure |
1. Introduction
The European Project Semester (EPS) is a program during which students from different countries with different academic backgrounds are developing a new product. In the first chapter, will present the team members will be present and will go more into detail about the problem and our goal to solve it.
1.1 Presentation
The 641 team is part of the European Project Semester (EPS) in spring 2020, at Instituto Superior de Engenharia do Porto (ISEP). Six students from different countries, each one linked to a different culture, with distinctive habits, skills, and scientific fields, have come together to embrace a common challenge: develop a multidisciplinary project to collect floating waste.
Our scientific backgrounds are shown below, in Table 1.
| Name | Country | Course of study |
|---|---|---|
| António Santos | Portugal | Electrical and Computer Engineering |
| Bianca Serafia | Romania | Industrial Engineering |
| Davide Caddia | Italy | Civil Engineering |
| Evelien Zeeman | Netherlands | Applied Mathematics |
| Laura Castañer | Spain | Industrial Design and Product Development |
| Patrick Jørgensen | Norway | Mechanical Engineering |
Unfortunately, due to the COVID-19 outbreak, Patrick is no longer a member of the team.
641 is presented below, in Figure 1, identifying each member, just as the team was initially structured.

1.2 Motivation
We have chosen to join the EPS program for multiple reasons. First of all, we are interested in working with students from different countries and study fields. Secondly, we aim to improve our English skills. Thirdly, we would like to improve our public speaking and academic writing skills. Finally, we want to improve our collaboration skills.
For our project subject, we have set some requirements. We wanted a project that every member of our project group could contribute to. Furthermore, our project contributes to an essential issue and addressing a worldwide problem, the pollution of the environment. Also, we want our project result to be feasible.
1.3 Problem
Each year an estimated 8 million tons, or 17 billion pounds, of plastic flows into the ocean. First and foremost, an endless flow of trash into the ocean will affect the health of humans and wildlife alike as well as compromise the livelihoods that depend on a healthy ocean. Trash and debris such as fishing gear, straws, and plastic bags pose a deadly threat to marine life. Fishing gear can trap helpless sea turtles and cut through the flesh of whales, while plastic bags are easily mistaken as food and consumed by animals. Straws can be hazardous in that they can get stuck in a nostril, a blowhole, an eye, or even a throat [Tori Glascock, 2016].
No one knows how much unrecycled plastic waste ends up in the ocean, Earth’s last sink. In 2015, Jenna Jambeck, a University of Georgia engineering professor, caught everyone’s attention with a rough estimate: between 5.3 million and 14 million tons each year just from coastal regions. Most of it isn’t thrown off ships, she and her colleagues say, but is dumped carelessly on land or in rivers, mostly in Asia, then blown or washed into the sea. Only less than 1% of the plastic in the oceans does not float on the surface [Utrecht University, n.d.].
Meanwhile, ocean plastic is estimated to kill millions of marine animals every year. Nearly 700 species, including endangered ones, are known to have been affected by it. Some are harmed visibly—strangled by abandoned fishing nets or discarded six-pack rings. Many more are probably harmed invisibly. Marine species of all sizes, from zooplankton to whales, now eat microplastics [Laura Parker, 2018]. Scientists have found microplastics in 114 aquatic species, and more than half of those end up on our dinner plates. Now, they are trying to determine what that means for human health [Elizabeth Royte, 2018].
Most plastic is not dumped intentionally into the ocean. It has been discovered that the majority of the plastic ends up in the ocean through rivers. Because plastic is light and there is so much of it, it ends up being washed down drains by rainwater or blown by the wind into bodies of water that flow into rivers and, ultimately, the ocean. To make matters more challenging, not all plastic is floating on the surface of the water. Plastic has been found in the furthest reaches of the ocean, from the deepest waters of the Mariana Trench to the Arctic and Antarctic [Julia Jacobo, 2019].
Plastic waste threatens lakes as well as oceans. Pollution with plastic waste is not confined to the oceans but poses a growing threat to lakes as well. Researchers who found significant concentrations of the substance in Italy's Lake Garda say that the levels are similar to those found in samples taken from marine beach sediments and that these tiny plastic particles are accumulating in freshwater species and are likely to get into the food chain. Chemicals found in plastics can be poisonous, can damage endocrine systems, or in some cases, cause cancers. The scientists are also concerned that the discovery of significant amounts of plastic in lake environments could have implications for human populations as the waters are often used for drinking and for agriculture [Matt McGrath, 2013].
Unlike ocean plastics, which can get caught up in currents and circulate around the globe, the material swirling in lakes has nowhere to go. It usually comes from nearby sources, such as sewer pipes carrying refuse that’s been washed into street drains, washing machines that send microfibers into city treatment systems, and windblown litter from beachgoers or lakeside neighborhoods [Susan Cosier, 2020].
The team wants to make a start with collecting the trash that has already ended up in natural waters. Collecting the trash should be done continuously and automatically. Lakes are closer to human interaction than oceans, making Soaksy a visible solution and the water pollution a visible problem. Therefore, it is also an educational tool for people, designed to fulfill both purposes.
1.4 Objectives
The main objective of the project is to develop a sustainable and efficient floating trash collector. This objective involves designing, building, and testing the prototype.
In the designing phase, our main concerns will be related to the collecting system, power source and the sensors. When it comes to the building phase, our objectives will consist of creating the list of materials needed, procuring and assembling each component, considering the design, in a sustainable and ethical manner. Finally, testing the product is essential. Our objective of this phase is to have a working prototype, improving it if needed.
1.5 Requirements
When developing the project, the International System of Units will be used. When it comes to the budget of the project, a maximum of 100 € is allowed, implying a clean, simple design, with low-cost materials.
Functional requirements:
- Continuous cleaning
- Low energy consumption
- Easy maintenance
- Recyclable components
Standard requirements: - Comply with the following EU Directives:
- Machine Directive (2006/42/CE 2006-05-17);
- Electromagnetic Compatibility Directive (2004/108/EC 2004 12 15);
- Low Voltage Directive (2014/35/EU 2016-04-20);
- Radio Equipment Directive (2014/53/EU 2014-04-16);
- Restriction of Hazardous Substances (ROHS) in Electrical and Electronic Equipment Directive (2002/95/EC 2003-01-27);
- Mandatory adoption and use of the International System of Units (The NIST International Guide for the use of the International System of Units)
- Use open-source software and technologies
- Maximum budget: 100 €
1.6 Functional Tests
A set of tests is required in order to verify all the aspects that need to be accomplish, such as mechanical, electrical, and software concerns, described in Table 2.
| Condition | Expected result |
|---|---|
| Voltage regulators output | The power distribution circuit has as output appropriate values for the system loads. |
| Water level sensor and temperature sensor controlling pump | The microcontroller processes the information from both sensors and acts on the pump according to the present condition. |
| Ultrasonic sensor readings | The microcontroller is capable of processing the information from the ultrasonic sensor and displaying distance values. |
| IoT platform communication | The online platform receives test values from the microcontroller. |
| Dashboard displaying information | Display information according to the data sent by the microcontroller. |
1.7 Project Planning
Project Planning is developed according to Agile and Scrum methodologies. This process helps to coordinate and improve the communication of the team by creating a Project Backlog. A Project Backlog is a list of tasks that have to be done during the project. This Project Backlog makes sure that each team member knows what tasks are in progress and who is doing what. The team members pick a time period. This time period is called a sprint. For every sprint, the team sets a goal. Based on the available amount of working hours in the sprint, the tasks are defined to fit into the sprint duration. It is necessary to have a daily stand-up to overview each team member's daily progress during a sprint. When the sprint is finished, the team creates a retrospective to analyze how to solve possible issues and improve for the next sprint.
The Scrum methodology is presented in Figure 2.

1.8 Report Structure
Our report consists of 8 chapters, each of them addressing a different issue, as shown in Table 3.
| 1 | Introduction | Presentation of the team members, of the project purpose, requirements, and objectives. |
| 2 | State of the Art | Research of different existing products, scientific studies or ideas on the market. |
| 3 | Project Management | Documentation of the progress in the Agile management and SCRUM. |
| 4 | Marketing Plan | Identify the main target group and strategies to introduce our product in the market. |
| 5 | Eco-efficiency Measures for Sustainability | Analysis of Economical, environmental and social, Life Cycle. |
| 6 | Ethical and Deontological Concerns | Analysis of the ethical challenges and their solutions. |
| 7 | Project Development | Steps to do along with the project: Concept, architecture, components, materials, prototype. |
| 8 | Conclusions | Summary of the results and possible future development. |
2. State of the Art
2.1 Introduction
As mentioned in the introduction to this report, many floating waste is found in rivers, lakes and oceans. The goal of our product is to automatically and continuously keep as much floating garbage as possible, without interfering with the ecosystems present in the lakes. Before deciding exactly what will be our product, the products and ideas already existing are compared in this chapter, before taking a conclusion.
2.2 Existing products
2.2.1. Seabin Project
The original idea with floating garbage bins to collect trash was first introduced by two Australian surfers in 2015. The prototype was simple: A bin, a pump, and a net. The pump made water and debris converge into the bin, while the net made sure that only water and small particles escaped the bin. Since then the technology has not seen great upgrades. There have been two upgrades on the prototype in the last 5 years. The first one was a filter that will absorb other liquids than water. The second upgrade, still under testing, is a second bin that also traps microplastic and fibers inside the system [Seabin Project, n.d.].
There are a few other ideas for identical products created by small officials or communities. One of the prototypes from Malta uses solar panels to operate to pump. However, the construction is big relative to the amount of debris it can collect [Claudia Calleja, 2019].

2.2.2. WasteShark
The WasteShark was created in 2016 by the Dutch company RanMarine [TudoCelular, 2019]. This drone is modeled on the whale shark and is designed to clear plastics, bio-waste, and other debris from the water in ports and canals. Its capacity is 160 litres. Also, the WasteShark can measure water quality (temperature, pH, conductivity, DO, ORP, depth, turbidity) and has an onboard GPS and camera. Nowadays there are two available models on the market: manually controlled and autonomous WasteShark [RanMarine, n.d.]. The manual WasteShark costs 17 000 USD [Esan Swan, 2018]. This model has a battery life of 8 hours and the drone can be controlled within a range of 3 km. The costs of the autonomous WasteShark are 23 000 USD [Esan Swan, 2018].
The company BluePhin Technologies in the United Arab Emirates sells a very similar product called the BluePhin [BluePhin Technologies, n.d.].

2.2.3. Mr. Trash Wheel
Mr. Trash Wheel is an initiative of the American company Waterfront Partnership of Baltimore and was installed in 2014 [Waterfront Partnership, n.d.]. Two barriers with a skirt underneath are placed in a river and Mr. Trash Wheel is placed in the middle. The waste flows with the current of the river to Mr. Trash Wheel. Then the waste is placed on the conveyor belt. This belt is powered by a water wheel. If there is not enough water current, solar panels power the system to keep it churning. When the waste reaches the top of the conveyor belt, the trash falls into a dumpster. When the dumpster is full, this dumpster is replaced by an empty dumpster [Waterfront Partnership, n.d.].

2.2.4. The Ocean CleanUp
The Ocean Cleanup is a Dutch non-governmental organization founded in 2013 by Boyan Slat [Wikipedia, 2020]. The goal of this organization is to remove the plastic from the oceans. To achieve this goal, the organization has a two-part plan: closing the source and cleaning up what has already accumulated in the ocean and does not go away by itself. This means plastic is intercepted in rivers and the plastic is removed from the oceans.
For cleaning the rivers, a barrier and an Interceptor are used. With the help of the government, the barrier is placed in a strategic location in the river. River waste flowing with the current is guided by the barrier towards the opening of the Interceptor. Then the floating waste is placed on the conveyor belt of the Interceptor. The conveyor belt delivers the waste to the shuttle and the shuttle distributes the waste equally over the six dumpsters using sensor data. When the six dumpsters are full, a boat is sent to the Interceptor to empty the dumpsters.
The Interceptor is energy neutral. The waste enters the Interceptor with the current of the river and solar energy is used to power the Interceptor. Since it does not use one barrier, but two separate barriers, boats can still pass. [The Ocean Cleanup, n.d.]

A long floater, net-like skirt, cork line, and sea anchor are used for cleaning the oceans. The floater makes sure the whole system floats. Underneath the floater, hangs the skirt. The skirt prevents debris from escaping the system underneath. The cork line prevents overtopping and keeps the skirt floating.
Since active cleanup methods would be too energy-consuming, passive design is chosen for this system. Natural forces (wind, waves, and current) are used to move both the system and the waste in the ocean. By only using these natural forces to move, the system automatically moves to the waste. Because the waste is also moved by these same natural forces.
To catch the waste, the system’s speed should be slower than the speed of the waste. This is why the sea anchor was added to the system. The sea anchor slows down the system, and make sure the system collects waste [The Ocean Cleanup, n.d.].

2.2.5. The Great Bubble Barrier
The Great Bubble Barrier was founded in 2018 by three Dutch women. The Bubble Barrier is a tube with holes located on the bottom of the water. By pumping air through the tube, a bubble screen is created. It is placed diagonally in the waterway because that way it can use the current of the water to guide the trash into a catchment system at the riverside. Both fishes and boats can pass the Bubble Barrier. Moreover, the Bubble Barrier increases the oxygen level in the water. This stimulates the ecosystem and stops the growth of blue algae [The Great Bubble Barrier, n.d.].

2.2.6. SWS80
The SWS80 was created in 2018 by the Mexican company Tecno Productos GAB. This catamaran is designed to collect trash and algae in coastal waters by a sliding platform while the catamaran is in motion [Tecno Productos GAB, 2019]. The propulsion system is made of bronze propellers with a rudder. This design has a theoretical performance of up to 21 500 m2/h [Tecno Productos GAB, n.d.].

2.2.7. Pond Skimmer
Like pumps and filters, pond skimmers help to keep pond water clean and clear. Traditionally used to help remove floating debris from the surface of swimming pool water, in recent years, skimmers have become increasingly popular mechanisms for maintaining backyard ponds [Pond Professor, 2019].

2.3 Existing ideas
2.3.1. River Cleaning
River Cleaning is an Italian startup that deals with the removal of floating garbage in rivers. The river cleaning system is made up of a series of floating devices, positioned diagonally on the course of the river. These floating devices rotate in their axis; when positioned, they allow to intercept plastic waste and transport it to the riverbank, in a special storage area. This technology must be sized according to the size of the river, the strength of the current and any other conditions. It is possible to study the most suitable dimensions to make optimal performance. This system has been designed to come into contact with boats. [River Cleaning, n.d.]

2.3.2. Blue Barriers
SEADS is an Italian startup that invented the Blue Barriers. The barriers are floating barriers, rigid with a resistance that can withstand any condition of the river and large objects carried by currents, such as trees. They will be made of recycled plastic. The barriers can be staggered to allow the normal passage of boats and fish.
They will be positioned diagonally with respect to the flow of water to create a current that transports the waste towards the riverside, where the waste will be accumulated, collected, and sent for selection or recycling. The selection and recycling centers will be placed near the barriers and will be able to accept waste from neighboring areas, creating a service for the community and new jobs for the locals.
At the moment, SEADS made a scale prototype of these barriers and filed a patent. They are working with the University of West of Scotland, Universitas Indonesia, Università di Firenze (University of Florence) and Politecnico di Milano [SEADS, n.d.].

2.4 Comparison
Based on the two previous sections, the products/ideas are divided into three types of products. The first type is the water bin represented by the Seabin Project. A water bin is a small product that stays in place and uses a pump to suck water and debris into it. The second type is the water robot, and the WasteShark and BluePhin fall in this category. A water robot is a small moving product that collects trash by pushing the trash to one location. Thirdly is the barrier with a trash collector. The Ocean Cleanup for rivers, Mr. Trash Wheel, The Great Bubble Barrier, River Cleaning, and SEADS fall in this category. A barrier with a trash collector is a static big product that uses the flow of the river and the barriers to collect trash.
In Table 4 below, these three types are compared.
| Water bin | Water robot | Barrier with collector | |
|---|---|---|---|
| Type of water* | Static | Dynamic | Dynamic |
| Autonomous* (1-5) | 3 | 3 | 4 |
| Capacity | 20 kg per bag, adding up to 3600 kg a day [Seabin Project, n.d.] | 500 kg per day [RanMarine, n.d.] | Ocean cleanup: 50 000 kg per day [The Ocean Cleanup, n.d.]. Mr Trash Wheel: daily capacity of 50 000 lb(22 600 kg) [Brandon Baker, 2014] |
| Power supply | Supply: 110 V / 220 V with a consumption of 2.5 A, rated at 500 W [Seabin Project, n.d.] | Supply: 12 V feed by 4 x Lithium Iron Phosphate (LiFe PO4) [Ecocoast, n.d.] | Ocean cleanup: Solar capacity of 5.6 kWp and Battery capacity of 20 kWh Li-ion [The Ocean Cleanup, 2019]; Mr. Trash Wheel: Maximum solar output of 2.5 kW [Waterfront Partnership, n.d.] |
| Green energy | If available can use energy from sustainable sources; in most cases Grid [Global Opportunity Explorer, 2018] | Solar power to charge batteries [Olga Koltsova, 2017] | Ocean cleanup: Solar energy [The Ocean Cleanup, 2019]. Mr. Trash Wheel: Water flow energy [Waterfront Partnership, n.d.] |
| Collecting trash efficiency* (1-5) | 3 | 2 | 4 |
| Maintenance* (1-5) | 2 | 3 | 5 |
| Price range | from 3300 € up to 6300 €, depending on location [Mariel Myers, 2018] | from 15 500 € up to 20 000 €, depending on the model [Esan Swan, 2018] | Mr Trash Wheel: 90 000 € per year [Alexander Tullo, 2018] |
| Impact on environment | Less visible, doesn’t interfere with boats and marine life [Matt Weiser, 2016] | Small impact [Catherine Collins, 2018] | Large but non invasive [The Ocean Cleanup, n.d.] |
| Versatility* | Lakes, pools, oceans, fountains | Ports, lakes (still water) | Rivers (small and medium size) |
2.5 Conclusion
The already existing products can be divided into three types. The first type is the water bin represented by the Seabin Project. A water bin is a small product that stays in place and uses a pump to suck water and debris into it. The second type is the water robot, represented by the WasteShark . A water robot is a small moving product that collects trash by pushing the trash to one location. Thirdly is the barrier with a trash collector represented by the Mr. Trash Wheel. A barrier with a trash collector is a static big product that uses the flow of the river and the barriers to collect trash.
Considering that the places closest to the populations will be the ones that are most polluted, a water bin or water bot type product would be the ideal implementation for lakes and community ponds, with the advantage of these places being of static water, which in turn would make the product easier to install and maintain, when compared to dynamic water places where the barrier type products with collector operate. Static water products also have the advantage of lower production costs, as they are smaller than dynamic water products. With the smaller size also comes the advantage of having less visual impact on the environment. But among static water products the water bin type stands out for its energy efficiency as it does not spend energy moving when collecting floating waste, as the water robot type operates. With the benefit of greater energy efficiency also comes greater uptime, since the water bin type can be powered by ground power, including from renewable sources, while the water robot type depends on batteries to operate.
The conclusion is that the best choice for a floating waste collector would be a water bin type product. Furthermore, the team is confident that its solution would be cheaper and easier to use than the existing water bins.
To further specify the product, a study was carried out to determine the best solution for the power supply as well as the location of the water pump required for a water bin project. The results can be seen in Table 5.
| Pros | Cons | |
|---|---|---|
| Power from the power Grid | Support any pump; The Grid may have a big percentage of renewable energy | Dependent of the Grid, with all the consequences it comes with; Can't be used in remote areas |
| Power from renewable source | Sustainable source; Independent from the Grid | More expensive; More constraints on the pump rating |
| Pump in water | Compact design | Adds instability to the product; less powerful; more weight on the final product |
| Pump on land | Could have more power for the same price; Easier maintenance; Could be more robust | Less compact product; Uses more energy to pump water |
In conclusion of the study of the power supply and location of the water pump, it is concluded that the best solution would be a hybrid power supply, using power grid and renewable energy, and a submersible water pump.
3. Project Management
3.1 Introduction
For the success of a project an adequate planning is essential. After having determined the main objectives, costs and resources available the management strategy of the project is presented.
3.2 Scope
Scope definition is an essential part of project planning. It helps to determine tasks and distribute all resources. First of all, the team has determined the main objective of the project. Next, the team used a simple hierarchical decomposition structure of all tasks and products that are essential to achieve the final result of the project. One of the widely used structures is a Work Breakdown Structure (WBS), which visually divides the scope into sections, where each provides further definition and detail.
The WBS in Figure 13 is divided into six stages: Initial, Design, Interim, Executive, Test and Final stage. Each stage consists of multiple tasks.

3.3 Time
During the EPS@ISEP project, the following deadlines are set:
- 2020-02-24 Project proposal
- 2020-03-05 Project Backlog, Global Sprint Plan, Initial Sprint Plan, Release Gantt Chart
- 2020-03-10 Black Box Diagram, System Diagrams and Structural Drafts
- 2020-03-27 System Schematics, Structural Drawings, 3D Modelation and cardboard scale model
- 2020-04-01 List of Materials (what & quantity)
- 2020-04-08 Interim Report
- 2020-04-16 Interim Presentation, Discussion and Peer, Teacher and Supervisor Feedbacks
- 2020-04-23 List of Materials (provider, price, quantity, including VAT and transportation)
- 2020-04-30 Final video of the 3D Model
- 2020-05-06 Refined Interim Report
- 2020-05-13 Packaging solution
- 2020-06-02 Functional Tests
- 2020-06-12 Final Report, Presentation, Video, Paper, Poster and Manual
- 2020-06-16 Final Presentation, Individual Discussion and Assessment
- 2020-06-19 Update the Wiki
- 2020-06-23 Demo of prototype or 3D model, simulation and companion applications
Based on the WBS in Figure 13 and the deadlines, the Gantt Chart was created, as seen in Figure 14 below. This Gantt Chart uses the six stages as shown in the WBS (Figure 13) instead of using all the tasks, because with all the tasks in it, the Gantt Chart would look to complex and unusable. During every stage, the team continues working on the report. Furthermore, also the holidays are visible in pale pink and the weekends in pale grey.

3.4 Cost
In this section the planned and effective costs of the project are documented. First, look into the costs for the materials and components of our prototype and secondly, the costs of labor.
3.4.1. Material costs
The materials for the actual product are not decided yet. Nevertheless, the research for the materials of the prototype is done in section 7.3 Components and in section 7.4 Final list of components the material costs for the prototype are shown. Based on this list, the material costs are calculated. Table 6 shows the list of components for the prototype and the total material costs. The material costs for the prototype will be €107.93 in total.
| Functionality | Name | Price (€) |
|---|---|---|
| Pump | Velleman VMA421: Water Pump | 12.20 |
| Distance sensor Sensor | JSN-SR04T-2.0 Ultrasonic Waterproof Range Finder | 16.50 |
| Water level sensor | Water level sensor | 2.90 |
| Temperature sensor | DS18B20 | 4.65 |
| Microprocessor | Espressif ESP32 DevKitC-32D | 13.60 |
| Logical level converter | 3.3 V & 5 V Logic Level Converter | 2.5 |
| MOSFET | BS170 | 0.31 |
| Switch | 3 A / 250 V AC TOOGLE MINI SWITCH | 0.65 |
| 12 V to 3.3 V and 5 V DC/DC converter | DC-DC Buck Converter Step-down 12 V to 3.3 V / 5 V | 3.81 |
| Wide input voltage to 12 V DC/DC converter | XL6009 DC-DC Boost Buck Adjustable Step-Up Voltage Converter Module | 4.06 |
| Schottky diode | SB2100 - Schottky Diode 2 A 100 V | 0.54 (3 units) |
| Power supply AC/DC to 12 V | Switching Power Supply 12 V 1.5 A | 4.80 |
| Photovoltaic panel | Photovoltaic Panel Silicon Monocrystalline 20 W / 12 V | 29.99 |
| Bird repeller | Holographic Owl | 6.26 |
| Delivery fees | . | 21.38 |
| Total | . | €124.15 |
3.4.2. Labor costs
As EPS students, the team does not have income. But it is interesting to see what the labor costs will be, if the team decides to establish an actual company after the EPS. The average nominal wage in Portugal is €1188.06 per month [Trading Economics, 2019]. Being a start-up, the company does not earn profit yet. That is why the monthly wage of our employees will be lower than the average nominal wage in Portugal, for the first year at least. Each of our employees will earn €1000 per month in the first year. The labor costs for the first year is shown in Table 7. The labour costs for the first year of our start-up will be €60,000.
| Employee | Monthly wage (€) | Yearly wage (€) |
|---|---|---|
| Antònio | 1,000 | 12,000 |
| Bianca | 1,000 | 12,000 |
| Davide | 1,000 | 12,000 |
| Evelien | 1,000 | 12,000 |
| Laura | 1,000 | 12,000 |
| Total | €5,000 | €60,000 |
3.5 Quality
In this section of the report, the project quality will be discussed. Project quality means meeting the needs of the customers, i.e. fit for use. The project quality is divided in two quality types: Service Quality and Product Quality. Both are found important for the customers of our company. Our company will guarantee this quality with the following plan.
3.5.1. Service Quality
User manual
The manual shows the different components of the Soaksy and explain how the Soaksy works. This will reduce the number of questions that the customer has. Moreover, the manual prevents accidents caused by incorrect use from happening.
Returnable product
When the Soaksy is not working anymore, the customer can reach the company via email or phone and the company will pick it up for free. The company will recycle the usable parts of the Soaksy and so be more sustainable.
Website
Using the website soaksy.com helps us to be visible for possible customers and owners of the Soaksy. The website must contain the following topics:
- Information about Soaksy
Explains what the Soaksy does and convinces possible customers to buy the Soaksy. - Information about the team
Introduces the team members and discusses our motivation to create the Soaksy. - FAQ
The Frequently Ask Questions and their answers help customers to find an answer on our website to questions that are already asked by previous customers. - How to reach us (Email and phone number)
If the question can not be found in the FAQ, the (possible) customer can reach via email and phone.
- Reviews
A customer can leave a review about the Soaksy. That way, possible customers can read the opinions of the Soaksy users.
- User Manual
The user manual will be delivered together with the Soaksy and will also be available on our website.
- Terms and Conditions
3.5.2. Product Quality
Functional requirements
Our soaksy should meet the following functional requirements to meet the need of the customer:
- Continuous cleaning
- Low energy consumption
- Easy maintenance
- Recyclable components
Inspection
Before delivering the Soaksy to a customer, it should be checked for errors.
Continuous improvement
For the product Soaksy to stay marketable, the company must improve the product continuously.
3.6 People
The people related to the project, the human resources, are one of the key factors for a successful project. The team members are an important part of the human resources. They are responsible for multiple tasks. By allocating the tasks to specific team members, the team knows who is doing what at any time. Moreover, the team knows who is responsible for every task. If some task is failing, the team can easily find out who is responsible for this and help. Table 8 presents the allocated tasks and the responsible team members.
| Task | Responsible |
|---|---|
| Initial research | |
| Task allocation | Team |
| Introduction | Bianca, Evelien |
| Market research | Davide, Evelien, Laura |
| Planning | |
| Gantt chart | Evelien |
| Black box diagram | António |
| Design | |
| 3D Models | Bianca |
| Schematics | António |
| Structural Drafts | Bianca |
| Technical Drawings | Bianca |
| List of materials | António |
| Interim report | |
| State of the art | Davide, Evelien, Laura |
| Project management | Bianca, Evelien |
| Marketing plan | Evelien, Laura |
| Sustainability concerns | António |
| Ethical concerns | Evelien |
| Building | |
| Animation/Simulation | Bianca, Davide |
| Materials assembly | Team |
| Electrical circuit | António |
| Testing | |
| Functional tests | Team |
| Sensors | António |
| Final | |
| Report and presentation | Team |
| Poster, Paper, Video, Leaflet | Davide, Laura |
| Review of content | Bianca, Evelien |
Apart from the team members, other people are also involved in the project. Together the team members and these people are referred to as stakeholders. A stakeholder is defined as an individual, group, or organization, who may affect, be affected by, or perceive itself to be affected by a decision, activity, or outcome of a project [Project Management Institute, 2000]. The stakeholders in this project and their role are presented in Table 9.
| Stakeholder | Role |
|---|---|
| Team members | Owners |
| Benedita Malheiro | EPS coordinator |
| Benedita Malheiro, Cristina Ribeiro, Jorge Justo, Manuel Silva, Paulo Ferreira, Pedro Barbosa Guedes | Supervisors |
| Ana Barata, António Arrais de Castro, Cláudia Facca, Luís Castanheira, Luis Lopes, Paulo Ferreira, Sandra Luna | Teachers |
| ISEP | Sponsor |
| Suppliers | Suppliers |
| Customers | Final users |
3.7 Communications
A project as multidisciplinary and diverse as what the one being made, it would be impossible without good communication. That is why it is necessary to ensure that all members have the opportunity to express their convictions (thus increasing positive discussions and diversity of opinion) and to ensure that the problems that arise during the project are properly addressed. Poor communication can worsen time management and deteriorate the relationship between team members. Communication is one of the pillars of a good project.
PMI recommends the definition of a Communication Management Plan, documenting communication methods, models, technologies and frequency [Project managment institute, 2013]. According to the Project Management course, the Communication Management part should include :
- Mapping between stakeholders and communication needs: analysis of stakeholders, responsible for the provision of each type of communication, frequency, when and where each communication will take place;
- Communication methods and technologies used to communicate;
- Communication templates: how, in which format the information will be communicated and how the project information will be collected, communicated and distributed;
Due to the global health situation you can not have direct communication with team members, this type of communication is the fastest and the least misunderstood, to try to fill this gap you opt for telematic communication using apps and software that allow you to make video calls or share the screen in real time (Skype, Zoom, Teams) and messaging (WhatsApp, Messenger).
| What | Who | Why | When | How |
|---|---|---|---|---|
| Deliverables | Everyone | To not miss the deadline | Before the deadline | Upload the wiki |
| Scheduling team meetings | Everyone | To schedule a team meeting | Everyday | |
| Holding team meetings | Everyone | To decide next steps/brainstorm/work on the project | Once a week | Skype |
| Meeting with the supervisors | Everyone | To inform the supervisors about the current state of the project | Every Thursday | Microsoft Teams |
| Interim presentation | Everyone | To get feedback from the supervisors for the first part of the project | 16-04-2020 | Zoom |
| Share researched materials | Everyone | To show the materials that have been researched | Whenever possible | Onedrive, WhatsApp, Wetransfer |
3.8 Risk
Risk is an uncertain event or condition that, if it occurs, has an effect on at least one project objective. Risk management shall focus on identifying and assessing the risks to the project and managing those risks to minimise the impact on the project. There are no risk-free projects because there are an infinite number of events that can have a negative effect on the project. Risk management does not consist of eliminating risks, but in identifying, assessing and managing risks [Wiley et al., 2012].
It is useful to make a distinction between what is a danger and what is a risk: The danger indicates something that has the potential to cause damage, while the risk is the probability of damage occurring, based on exposure to that danger.
In the project management classes, the team has been taught how to manage risks and how the risk process can occur. These steps of risk creation/effects are illustrated in table 11.
| Trigger | Cause | Event | Consequence |
|---|---|---|---|
| This is the event that begins to put things in place that will eventually start the risk process | This is incident that will directly result in the event that causes a change in our design / decision making process (otherwise known as the event) | This is what will happen to our project development process as a direct result of the cause of the risk | This is how our development process has been changed and how it has affected our project as it continues into the future |
As with any project, dealing with risks is inevitable, and so we have to accept them and assess whether we can control them. So instead of trying to control whether it will happen or not, let’s look at ways in which we can control the outcomes that arise as a result of these risks; some risks will affect the project more than others. During the completion of our project we are able to adopt some strategies to manage risks in the best possible way:
- Accept that risk is going to happen (if unavoidable) and work through it taking into account all the lessons that have been learned during the process of addressing the issue.
- Transfer the risk to someone more capable of solving the problem by removing the work from the workload and ensuring that it is addressed with my more qualified someone to solve the problem and this in turn eliminates the possibility of being harmful to your work.
- Avoid the risk altogether by modifying the process currently underway for one in which this risk will no longer be an issue means that you must be able to change the creative process or planning to no longer use any tool/ resources had to be used when dealing with the problem.
- Mitigate the risk of reducing the impact of such emissions and reduce the likelihood that the risk will always become a problem in the first place. This is a classic example of many hands doing light work and ensuring that the problem is not a big problem that consumes too much time/manpower/resources/etc.
| Description of the risk | Trigger | Effect | Probability | Impact | Importance | Strategy |
|---|---|---|---|---|---|---|
| Lack of appropriate prior knowledge | Not studying enough, thinking it may be too complicated | Have to fix these Knowledge | Medium | Medium | Medium | Do research, ask for help |
| Absence of team members | Illness, laziness, accidents, injury | Team can't work well | Low | Medium | High | Be in the meetings whenever it is possible |
| Design Error that causes water to damage the electronics | Lack of knowledge or human error | Product stop to work | Medium/High | High | High | Have a good design |
| Bugs in Software | Human Error | Product may Work Improperly | Medium/High | Low | Low | Repair error or find an alternative solution |
| Missing deadlines | Poor project management or unforeseen circumstances | Project failure | Low | High | High | Monitoring deadlines setting our own milestones earlier |
| Quarrel between team members | Misunderstanding/Personal problems | Project may suffer/bad work atmosphere | Medium | High | High | Maintain correctness/good relations |
| Stakeholder interference | Change in the current market or change of public appearance | Selling the product become harder | Medium | High | High | By continually updating our stakeholders on our projects and having meetings with them we can continually receive feedback from them |
3.9 Procurement
Procurement is the act of obtaining goods and services. The procurement procedure shall include the preparation and processing of an application, as well as the issuance of the receipt and approval of the payment. This is a vital part of any business, because it is impossible for a business to survive if the supply price is greater than the profit made by the product [Business Dictionary, n.d.].
To decide whether it is a good purchasing strategy for your company, these three points need to be implemented:
- Compare the quality-price ratio from the available suppliers.
- Take the maximum advantage of the material we have at our disposal.
- Look for suppliers located in Porto to decrease the shipping cost.
3.10 Stakeholders Management
A stakeholder is defined as an individual, group, or organization, who may affect, be affected by, or perceive itself to be affected by a decision, activity, or outcome of a project [Project Management Institute, 2000].The needs of the stakeholders should be met so that the risk to the project is low. By meeting their needs, the result would also be the best possible product. The stakeholders for the project in question are:
- Team members
- Benedita Malheiro
- Project supervisors, i.e. Benedita Malheiro, Cristina Ribeiro, Jorge Justo, Manuel Silva, Paulo Ferreira and Pedro Barbosa Guedes.
- Teachers, i.e. Ana Barata, António Arrais de Castro, Cláudia Facca, Luís Castanheira, Luis Lopes, Paulo Ferreira and Sandra Luna.
- ISEP
- Suppliers
- Customers
| Stakeholder | Role | Action | Interest | Influence | Reference |
|---|---|---|---|---|---|
| Team members | The project's creators | Develop the project | High | High | TM |
| Benedita Malheiro | Supervise closely | Manage the project closely | High | High | BM |
| Project supervisors | Supervise closely | Manage the project closely | High | High | PS |
| Teachers | Teach subject | Help providing knowladge | Medium/High | Medium | TC |
| ISEP | Sponsor | Provide resources to develop the project | High | Medium | ISEP |
| Suppliers | Provide neccessary materials | Sell supplies | Medium | Low | SU |
| Customers | Obtain the product | Buy the product | Low | Medium | CS |
A visual conceptual map helps to undertend how is distributed:

3.11 Sprint Outcomes
Scrum is a framework for project management that emphasizes teamwork, accountability and iterative progress toward a well-defined goal [M. Rouse, n.d.]. This framework uses the following:
- Daily stand-up Every day the team has a short stand-up meeting. During the daily stand-up the team reviews what was done the day before and plans what work will be done in the current day. Also, problems that happened are discussed.
- Sprint planning Every Monday the team plans what will be done in the current week. The planned tasks are allocated to certain team members and the duration of each task is estimated.
- Sprint review Every Friday the team reviews the sprint planning that was made on Monday. The team discusses which tasks are completed and which tasks are not. If a task is completed, the real duration is added.
- Sprint Retrospective Every Friday the team reflects on the sprint process. It is discussed what was positive and what was negative. Based on the positive and negative reflection, three categories are created: Start doing, keep doing, stop doing.
Based on the academic calendar offered by EPS@ISEP, the number of sprints is decided as well as their start and finish date. When each sprint takes place is shown in Table 14.
| Sprint | Start | Finish |
|---|---|---|
| 1 | 09-03-2020 | 13-03-2020 |
| 2 | 16-03-2020 | 20-03-2020 |
| 3 | 23-03-2020 | 27-03-2020 |
| 4 | 30-03-2020 | 03-04-2020 |
| Easter Break | 06-04-2020 | 13-04-2020 |
| 5 | 14-04-2020 | 17-04-2020 |
| 6 | 20-04-2020 | 24-04-2020 |
| 7 | 27-04-2020 | 01-05-2020 |
| 8 | 04-05-2020 | 10-05-2020 |
| 9 | 11-05-2020 | 15-05-2020 |
| 10 | 18-05-2020 | 22-05-2020 |
| 11 | 25-05-2020 | 29-05-2020 |
| 12 | 01-06-2020 | 05-06-2020 |
| 13 | 08-06-2020 | 12-06-2020 |
| 14 | 15-06-2020 | 19-06-2020 |
| 15 | 22-06-2020 | 26-06-2020 |
The Project Backlog consists of all deliverables that should be completed during EPS@ISEP. The Project Backlog Items (PBI) are ordered based on priority, i.e. highest priority at the top and lowest priority at the bottom. Each deliverable also has a status: To do, Doing or Done. Thus the Project Backlog is continuously updated. If a deliverable is done, then it lowers in the Project Backlog. In Table 15 the Project Backlog is shown.
| PBI | Title | Status |
|---|---|---|
| A | Product concept | Done |
| B | Backlog | Done |
| C | Global Sprint Plan | Done |
| D | Gantt chart | Done |
| E | Blackbox Diagrams and Structural Drafts | Done |
| F | Interim report | Done |
| G | Structural Drawings | Done |
| H | List of Materials | Done |
| I | Refined Report | To do |
| J | Building prototype | To do |
| K | Functional tests | To do |
| L | Final Report | To do |
| M | Final presentation | To do |
| N | Video | To do |
| O | Paper | To do |
| P | Poster | To do |
| Q | User Manual | To do |
The completed sprints are presented in Table 16. These sprints are weekly and based on the Global Sprint Plan (Table 14) and the Project Backlog (Table 15). The team begins a new sprint every Monday and ends the sprint every Friday.
| Sprint Plan 1 | ||||
|---|---|---|---|---|
| Task | Estimated duration (h) | Real duration (h) | Members involved | Status |
| Global Sprint Plan | 1 | 0,5 | Evelien, Davide | Done |
| Work Breakdown Structure | 1 | 1 | Evelien, Bianca | Done |
| Initial Sprint plan | 1 | 1 | Bianca | Done |
| Black Box Diagram | 1 | 2 | Antonio | In progress |
| Structural Drafts | 2 | - | Bianca | In progress |
| Introduction report | 6 | - | Bianca, Evelien, Laura | In progress |
| State of the art | 10 | - | Evelien, Patrick, Davide, Laura | In progress |
| Backlog | 1 | 1 | Bianca, Antonio | Done |
| Gantt chart | 3 | - | Patrick, Laura | In progress |
| Introduction of chapters | 2 | 1 | Davide | Done |
| Comparison table | 2 | 2 | Team | Done |
| Decide product concept | 5 | 5 | António, Bianca and Patrick | Done |
| Flyer | 5 | 3 | Davide | Done |
| Sprint Plan 2 | ||||
| Task | Estimated duration (h) | Real duration (h) | Members involved | Status |
| Black Box Diagram | 1 | 2 | Antonio | Done |
| Structural Drafts | 2 | 4 | Bianca | Done |
| Introduction report | 6 | - | Bianca, Evelien, Laura | In progress |
| State of the art | 10 | 10 | Evelien, Patrick, Davide, Laura | Done |
| Gantt chart | 3 | - | Patrick, Laura | In progress |
| Leaflet | 5 | 3 | Laura | Done |
| Logo | 3 | 1 | Bianca | Done |
| List of Materials | 8 | - | António, Patrick and Laura | In progress |
| Sprint Plan 3 | ||||
| Task | Estimated duration (h) | Real duration (h) | Members involved | Status |
| Introduction report | 6 | 9 | Bianca, Evelien, Laura, António | Done |
| Gantt chart | 3 | - | Patrick, Laura | In progress |
| List of Materials | 8 | - | António, Patrick and Laura | In progress |
| Marketing Chapter | 15 | - | Evelien, Laura | In progress |
| Sustainability Chapter | 15 | - | António | In progress |
| Ethics Chapter | 15 | - | Evelien, Davide | In progress |
| Sprint Plan 4 | ||||
| Task | Estimated duration (h) | Real duration (h) | Members involved | Status |
| Interim presentation Powerpoint | 2 | 4 | Davide | Done |
| Gantt chart | 3 | 2 | Evelien | Done |
| List of Materials | 8 | - | António | In progress |
| Introduction check | 1 | 1 | Bianca | Done |
| State of the Art check | 1 | 1 | Bianca | Done |
| Project Management | 15 | - | Bianca, Evelien | In progress |
| Marketing | 15 | - | Evelien, Laura | In progress |
| Sustainability | 15 | - | António | In progress |
| Ethics | 15 | 5 | Evelien, Davide | Done |
| Project Development | 10 | - | António, Bianca | In progress |
| Sprint Plan 5 | ||||
| Task | Estimated duration (h) | Real duration (h) | Members involved | Status |
| Interim Presentation | 2 | 2 | Team | Done |
| List of Materials | 8 | - | António, Bianca | In progress |
| Project Management | 15 | - | Bianca, Evelien | In progress |
| Marketing | 15 | - | Evelien, Laura | In progress |
| Sustainability | 15 | - | António, Davide | In progress |
| Project Development | 10 | - | António, Bianca | In progress |
| Sprint Plan 6 | ||||
| Task | Estimated duration (h) | Real duration (h) | Members involved | Status |
| Decide look and feel for our brand | 1 | 1 | Team | Done |
| Apply the look and feel to our materials | 2 | 2 | Davide, Laura | Done |
| List of Materials | 12 | - | António, Bianca | In progress |
| Apply teachers' feedback to report | 3 | - | Team | In progress |
| Apply teachers' feedback to flyer and leaflet | 1 | 1 | Davide, Laura | Done |
| 3.5 Quality | 2 | 2 | Evelien | Done |
| 3.6 Communications | 2 | - | Evelien | In progress |
| 4.2.1 Analysis of the macro environment | 1 | 1 | Laura | Done |
| 4.7 Budget | 1 | 2 | Laura | Done |
| 4.8 Strategy Control | 2 | 1 | Laura | Done |
| 4.9 Conclusion | 1 | 1 | Laura | Done |
| 5.5 Eco-efficiency measures | 2 | - | António | In progress |
| 5.7 Sustainability report | 1 | - | António | To Do |
| Sustainability chapter review | 1 | 1 | António | Done |
| Black Box Diagram improvement | 1 | 1 | António | Done |
| 7.5 Power Budget | 1 | 1 | António | Done |
| Project Development chapter review | 3 | - | António, Bianca | In progress |
| Sprint Plan 7 | ||||
| Task | Estimated duration (h) | Real duration (h) | Members involved | Status |
| 3D Model Video | 5 | 5 | António, Bianca, Davide | Done |
| List of Materials | 12 | - | António, Bianca | In progress |
| Apply teachers' feedback to report | 3 | 5 | Team | Done |
| 3.7 Communications | 2 | 2 | Davide | Done |
| 3.8 Risk | 2 | 1 | Davide | Done |
| 3.9 Procurement | 2 | 1 | Davide | Done |
| 3.10 Stakeholders Management | 2 | - | Laura, Evelien | In progress |
| 3.13 Conclusion | 1 | 1 | Laura | Done |
| 5.5 Eco-efficiency measures | 2 | - | António | In progress |
| 5.7 Sustainability report | 1 | - | António | To Do |
| Project Development chapter review | 3 | - | António, Bianca | In progress |
| Marketing chapter review | 1 | 2 | Evelien | Done |
| Paper Problem Statement | 1 | 1 | Evelien, Bianca | Done |
| Paper State of the Art | 1 | 1 | Evelien | Done |
| Microsoft Planner | 1 | 1 | Laura | Done |
| Sprint Plan 8 | ||||
| Task | Estimated duration (h) | Real duration (h) | Members involved | Status |
| Final 3D Model Video | 5 | - | António, Bianca, Davide | In progress |
| List of Materials | 12 | - | António, Bianca | In progress |
| 3.10 Stakeholders Management | 2 | 2 | Laura, Evelien | Done |
| 5.5 Eco-efficiency measures | 2 | 2 | Evelien, Davide | Done |
| 5.7 Sustainability report | 1 | 1 | Evelien | Done |
| Project Development chapter review | 3 | 2 | António, Bianca | Done |
| Refined 3D model | 5 | - | Bianca | In progress |
| Apply teacher Luis' feedback Marketing | 5 | - | Laura, Evelien | In progress |
| Apply teacher Luis' feedback Ethics | 2 | 2 | Davide | Done |
| Simulate the electrical circuit | 3 | - | António | In progress |
| Build IoT interface | 8 | - | António | In progress |
| Paper Project Development | 4 | - | António | In progress |
| Sprint Plan 9 | ||||
| Task | Estimated duration (h) | Real duration (h) | Members involved | Status |
| Final 3D Model Video | 5 | - | António, Bianca, Davide | In progress |
| List of Materials | 12 | 10 | António, Bianca | Done |
| Refined 3D model | 5 | 10 | Bianca | Done |
| Apply teacher Luis' feedback Marketing | 5 | - | Laura, Evelien | In progress |
| Simulate the electrical circuit | 3 | - | António | In progress |
| Build IoT interface | 8 | - | António | In progress |
| Paper Project Development | 4 | - | António | In progress |
| Packaging Solution | 5 | - | Laura | In progress |
| Chapter introductions check | 1 | 1 | Davide | Done |
| Weekly sprint meeting | 2 | 2 | Team | Done |
| Copy sprints from wiki to Microsoft Planner | 2 | 2 | Evelien | Done |
| Sprint Plan 10 | ||||
| Task | Estimated duration (h) | Real duration (h) | Members involved | Status |
| Final 3D Model Video | 5 | - | António, Bianca, Davide | In progress |
| Apply teacher Luis' feedback Marketing | 5 | 5 | Laura, Evelien | Done |
| Simulate the electrical circuit | 3 | 3 | António | Done |
| Build IoT interface | 8 | 3 | António | Done |
| Packaging Solution | 5 | 5 | Laura | Done |
| Weekly Sprint Meeting | 2 | 2 | Team | Done |
| Paper design | 1 | - | Bianca | To Do |
| Paper Project Development | 4 | - | António | In progress |
| Paper sustainability | 1 | 1 | Davide | Done |
| Paper ethics | 1 | 1 | Davide | Done |
| Insert list of materials on wiki | 1 | - | Bianca | In progress |
| User manual content | 4 | - | Bianca, António | To Do |
| Poster layout and design | 2 | - | Davide, Laura | In progress |
| Copy paper from OneDrive to Overleaf | 2 | - | Evelien | In progress |
| Sprint Plan 11 | ||||
| Task | Estimated duration (h) | Real duration (h) | Members involved | Status |
| Weekly Sprint Meeting | 2 | 1 | Team | Done |
| Final 3D Model Video | 5 | - | António, Bianca, Davide | In progress |
| Paper design | 1 | - | Bianca | In progress |
| Paper Project Development | 4 | - | António | In progress |
| Insert list of materials on wiki | 1 | - | Bianca | In progress |
| User manual content | 4 | - | Bianca, António | In progress |
| Poster layout and design | 2 | 2 | Davide, Laura | Done |
| Poster content | 1 | 1 | António | Done |
| Copy paper from OneDrive to Overleaf | 2 | 4 | Evelien | Done |
| Apply teacher Luis' new feedback Marketing | 5 | - | Laura, Evelien | In progress |
| Sprint Plan 12 | ||||
| Task | Estimated duration (h) | Real duration (h) | Members involved | Status |
| Final 3D Model Video | 5 | - | António, Bianca, Davide | In progress |
| Paper design | 1 | - | Bianca | In progress |
| Paper Project Development | 4 | - | António | In progress |
| Paper marketing | 1 | 1 | Evelien | Done |
| Insert list of materials on wiki | 1 | - | Bianca | In progress |
| User manual content | 4 | - | Bianca, António, Davide, Evelien | In progress |
| Apply teacher Luis' new feedback Marketing | 5 | - | Laura, Evelien | In progress |
| Weekly Sprint Meeting | 2 | 2 | Team | Done |
| Explain buoyancy | 1 | - | Bianca | In progress |
| Calculate buoyancy | 5 | 10 | Bianca | Done |
| User Manual design | 2 | 3 | Davide, Evelien | Done |
| Leaflet and flyer final version | 1 | 1 | Davide, Laura | Done |
| Apply teacher's feedback to IoT | António | Done | ||
| Apply teacher's feedback to Electrical Circuit | António | Done | ||
| Apply professor Ana's feedback to paper | 1 | 2 | Evelien | Done |
| Sprint Plan 13 | ||||
| Copy sprint plannings to wiki | 2 | 1 | Evelien | Done |
| Final 3D Model Video | 5 | - | António, Bianca, Davide | In progress |
| Paper design | 1 | 2 | Bianca | Done |
| Paper Project Development | 4 | 4 | António, Bianca | Done |
| Insert list of materials on wiki | 1 | 1 | Bianca | Done |
| User manual content | 4 | 4 | Bianca, António, Davide, Evelien | Done |
| Refine user manual | 3 | 3 | António, Davide | Done |
| Refine poster | 1 | 1 | Davide | Done |
| Apply teacher Luis' new feedback Marketing | 5 | 2 | Laura, Evelien | Done |
| Explain buoyancy | 1 | - | Bianca | In progress |
| Paper personal outcomes | 1 | 1 | Team | Done |
3.12 Sprint Evaluations
The Sprint Retrospective is also called Sprint Evaluation. Every Friday the team reflects on the sprint process. The team discusses what was positive and what was negative. Based on the positive and negative reflection, three categories are created: Start doing, keep doing, stop doing. Due to the outbreak of the coronavirus, the classes of Project Management were postponed and the team did not start in sprint 1 with the Sprint Retrospective. After sprint 5 the team started with doing Sprint Retrospectives. The Sprint Retrospective is shown in Table 17.
| Sprint | Positive | Negative | Start doing | Keep doing | Stop doing |
|---|---|---|---|---|---|
| 5 | Interim presentation and report went well | Started working on the report too close to the deadline Using chapters in sprint planning is vague | Working on the report on a daily basis Using sections in the sprint planning | Having skype meetings almost every day | Postponing work |
| 6 | The intern communication went well We estimated the duration of the planned tasks well We showed progress to the project supervisors Using sections in the sprint planning | We did not finish all the tasks we planned Some of us missed a meeting We did not do a daily meeting | Discussing via call instead of chat | Using sections in the sprint planning | Missing meetings |
| 7 | Combining work Follow scrum methods | Did not do all the tasks Sprint planning in three different places | - | Working well together | - |
| 8 | Patrick helped us | The final design of Soaksy is not done | Finish the design Focus on the bottlenecks in the planning | Ask for help if necessary | - |
| 9 | Focused on the 3D model | Our weekly meeting with supervisors takes longer than estimated Started working on deadlines late We did not ask team members to check our completed work | Discuss our agenda points in weekly meeting more directly Ask our team members to check our completed work | Focus on the bottlenecks in the planning | Postponing work |
| 10 | Completed a lot of uncompleted tasks from previous sprint | Planned tasks in sprint that we were not able to do | Plan sufficient amount of tasks in sprint planning Use Project Backlog Focus on quality over quantity Ask our team members to check our completed work | Completing tasks Focus on the bottlenecks in the planning | Plan too many tasks in sprint planning |
| 11 | Had more one to one meetings about a task Keep having weekly sprint meeting Still making progress with the project, although we work online | Motivation decreasing Stress increasing | Focus on finishing the project | Have the weekly sprint meeting | - |
| 12 | We are almost done with the final deliverables Used Project Sprint Backlog | Planned tasks in sprint that we were not able to do | Have daily meetings Split the bigger tasks into smaller tasks | Focus on finishing the project | Plan too many tasks in sprint planning |
| 13 | We made it to the end of EPS@ISEP, despite of the pandemic | Finishing deliverables near the deadline | Prepare final presentation Enjoying summer holiday | Focus on finishing the project | Postponing work |
3.13 Conclusion
In conclusion, by using Scrum methodology of working to develop our project instead of classical methodology has allowed the team to organize more properly. Planning together in a more Agile way has determined an optimal management strategy in order to achieve all objectives. Every Monday the team plans the Sprint's week which consists on dividing the work in different tasks to accomplish smaller goals just to be more productive. By estimating the time of which task will lasts and every team member is assigned the tasks according to their skills, this fact had helped us to save more time in each task and do it successfully. At the end of each specific Sprint we made a retrospective to know how to improve the next Sprint. In that way we can consider that the project had been managed efficiently and strategically.
In the next chapter, we will develop marketing plan and define potential marketing strategies.
4. Marketing Plan
4.1 Introduction
The goal of this chapter is to provide a marketing plan for our product, taking into account the current market. It will help us to identify possible issues, trends, opportunities, threats and where to invest time and resources to start our business.
The analysis will cover, in the first phase, the market and potential customers, then evaluate the objectives, the price, and finally, the discussion of the product and its promotion to establish the most appropriate market launch strategy for the product.To sum up, after having analysed these different points and created a solid base, the product will be able to establish long-lasting and ever-present relationships with the audience and market. The main steps that are going to be followed are:
First, the market analysis will collect information for designing a marketing strategy and concrete marketing measures that gives us an input to recheck the situation. It is divided in into three levels: two externals levels (macro and meso environment) and one internal level (micro environment). Second, the SWOT analysis will identify internal or external factors that are favourable or unfavourable for the viability company/product. Third, we will identify which are the Strategic Objectives of the product by using smarter methodology. Fourth, we will define and visualize the brand and the product position in the market. Fifth, we will develop a Marketing Mix, consisting of the 4 P's, to find the right combination of factors to provide value to target customers. The finals steps are the budget and strategy control to ensure that marketing objectives are attained.
4.2 Market Analysis
The Market analysis will define the work environment and helps to reduce the risk by understanding the potential market collecting and evaluating information by suppliers and buyers to make purchases or sales decisions and customer conditions. Knowing the market situation will let us to visualize the current position and establish future position of our product on it.
This analysis will be used to design a marketing strategy and concrete marketing measures that gives us an input to recheck the situation during the development process and make a more viable product. After have analysed the market and gather information we will be used to create SWOT matrix analysis in the next section that serves as a basis for visual decision-making.
The market analysis is divided into three levels (Figure 16):
- Macro environment: related to the contextual environment which includes Social, Technological, Legal, Economical, Environmental and Political developments.
- Meso environment: represents transactional environment, such as Demand, Suppliers, Distribution channels, Strategic partners, competitors and propositions.
- Micro environment: exposes about inner Organization values and goals defining the Vision, Mission, Strategy, Resources, Competences, Processes, Products and Services.
The macro and meso environment together form the external analysis and the micro analysis is the internal analysis.

4.2.1 Analysis of the macro environment
Macro environment is the vision of the market on a global scale. It analyses which future trends could change the demand and market behaviour, i.e. all factors that we are not able to manage, but will impact our product or organization. A variant of the PEST analysis is the PESTLE analysis. PESTLE is a really useful framework to assemble for a start-up company or when entering a foreign market. The PESTLE analysis consists of Political, Economical, Social, Technological, Legal and Environmental macro-environmental factors that must be taken into account for a marketing analysis. [CIPD, 2020]. These factors can be divided into Opportunities and Threats and can be used as a basis for the SWOT matrix.

Political
These determine the extent to which government and government policy may impact on an organisation or a specific industry. This would include political policy and stability as well as trade, fiscal and taxation policies [Oxford College of Marketing, 2016].
Opportunities
- Most European countries allow free flow of people and trade between countries [Schengen Agreement, 2017].
- The United Nations set 17 Sustainable Development Goals in 2015 that should be achieved by the year 2030 [United Nations, 2015]. The Soaksy contributes to fulfilling the goals Clean Water and Sanitation, Sustainable Cities and Communities, Climate Action and Life Below Water.
Threats
- The refugee and corona crisis in Europe probably put the Schengen Agreement under strain [Gideon Rachman, 2020].
- Citizens could lose faith in politics, if a prime minister mishandled the corona crisis [Chris Miller, 2020].
Economical
These factors impact on the economy and its performance, which in turn directly impacts on the organisation and its profitability. Factors include interest rates, employment or unemployment rates, raw material costs and foreign exchange rates [Oxford College of Marketing, 2016].
Opportunities
- People feel the need to be more environmental friendly, because we as humans have caused this environmental crisis [N. Matthews, P. Keys, 2019] and are willing to spend more money on the environment.
Threats
- Most economists assume that a worldwide recession is already underway, because of the corona crisis [L. Chutel S. Raj D. Politi P. Goodman, A. Dahir, 2020].
Social
These factors focus on the social environment and identify emerging trends. This helps a marketer to further understand their customers’ needs and wants. Factors include changing family demographics, education levels, cultural trends, attitude changes and changes in lifestyles [Oxford College of Marketing, 2016].
Opportunities
- Protecting the environment is found more and more important in the European countries [Environmental Performance Index, 2018].
Threats
- People might not like the Soaksy being always in the lake.
Technological
These factors consider the rate of technological innovation and development that could affect a market or industry. Factors could include changes in digital or mobile technology, automation, research and development. There is often a tendency to focus on developments only in digital technology, but consideration must also be given to new methods of distribution, manufacturing and also logistics [Oxford College of Marketing, 2016].
Opportunities
- More and more processes are automated [N. McCarthy, 2017].
Threats
- New cheaper and more efficient systems can be developed during the creation of the project design.
Legal
An organization must understand what is legal and permissible within the areas in which it operates. They must also be aware of any changes in legislation and the impact this may have on business operations. Factors include employment legislation, consumer law, healthy and safety, international as well as trade regulation and restrictions.
Political factors do cross over with legal factors; however, the key difference is that political factors are led by government policy, whereas legal factors must be complied with [Oxford College of Marketing, 2016].
Opportunities
- No relevant factors.
Threats
- The mechanisms of the Soaksy are quite similar to the Seabin.
Environmental
These factors relate to the influence of the environment and the impact of ecological aspects. With the increasing importance of CSR (Corporate Sustainability Responsibility), this element is becoming increasingly important. Factors include climate, recycling procedures, carbon footprint, waste disposal and sustainability [Oxford College of Marketing, 2016].
Opportunities
- An urgent need for clean-up in the maritime waters and lakes.
- The people tend to care more about the environment.
Threats
- Possible alteration of wildlife by the sound of aquatic pump.
4.2.2 Analysis of the meso environment
Suppliers
The definition of a supplier is a company or person that provides things that people want or need, especially over a long period of time [Cambridge Dictionary, n.d.]. Our supplier should be trustworthy, this means the supplier should provide the right products in short delivery periods offering favorable delivery terms. What we expect from our supplier is that he is cheap, delivers a good service and high quality products. The factory must be located in Portugal or close to Portugal in order to create a good relationship with the product and the location. Also, our product needs an electrical component that has to be purchased from an electric Portuguese company.
Possible suppliers in Portugal:
- Electronic and electrical components: PTRobotics [PTRobotics, 2020] or F.Fonseca [F.Fonseca, 2020].
- Cork material: CORKSRIBAS [CORKSRIBAS, 2020] or TCC SOLFLEX [TCC SOLFLEX, 2020].
- Plastics: Maxiplás [Maxiplás, 2020] or Simoldes [Simoldes, 2020]
Competitors
The definition of a competitor is a company in the same industry or a similar industry which offers a similar product or service [Business Dictionary, n.d.]. The competitors of the Soaksy are companies that also sell products or services that clean lakes. A competitive matrix consists of analyzing competitors whose products are comparable in order to know what they intend to offer. The Competitive Matrix for Soaksy is shown in Table 18.
| Seabin Strengths(+) and Weaknesses(-) | WasteShark Strengths(+) and Weaknesses(-) | Pond Skimmer Strengths(+) and Weaknesses(-) | Soaksy Strengths(+) and Weaknesses(-) | |
|---|---|---|---|---|
| Target market(s) | Governments(+) | Governments, private use | Governments, private use | Governments(+) |
| Product | - Needs a point of support on the ground(-) - Made of recycled material(+) - Easy Removable basket(+) - Equipped with oil absorbent pads able to absorb petroleum - Based surface oils and detergent(+) | - Dynamic(+) - 10h battery(-) - Needs constant supervision(-) - Laser technology to avoid collisions(+) - Water quality control(+) - Remote handheld control(+) - Removable basket cartridge for easy disposal(+) | - Different dimensions to choose(+) -Easy removable basket(+) - Emptying quite frequently(-) | - Needs a point of support on the ground(-) - Green powered supply(+) - Easy removable basket(+) - Made of recyclable material(+) |
| Price | High retail price (-) | High retail price(-) | Low retail price(+) | Low retail price(-) |
| Place | Online shop(+) | Online shop(+) | Online shop(+) | Online shop(+) |
| Promotion | - Active on Instagram, Facebook and Twitter(+) - Modern website(+) | - Difficult to find in medias directly from webpage(-) - Modern website(+) | No data for specific brand | Same as Seabin |
| (Potential) Competitive barriers | Well equipped product (+) | Complete product with lot of functionalities(+) | Medium product(+) | Medium product(+) |
Demand
Demand is defined as desire for certain good or service supported by the capacity to purchase it [Business Dictionary, n.d.]. The possible demanders may be one of the cities with the following lakes in the city or other cities with lakes.
- Barragem da Bravura, Algarve
- Lake Alqueva, Alentejo
- Lagoa Azul, Azores
- São Domingos, Alentejo
- The lakes of Cerveira
Partners
A partner is defined as company or individual who joins with other individuals (partners) in an arrangement (partnership) where gains and losses, risks and rewards, are shared among the partners [Business Dictionary, n.d.]. The Soaksy company could be partners with one or multiple non profit organizations that also want to clean natural waters. For example, The Ocean Cleanup could be our partner.
4.2.3 Analysis of the micro environment
For the analysis of the micro-environment, McKinsey's 7S model is used, consisting of Strategy, Structure, Systems, Management Style, Shared Values, Staff and Skills. McKinsey's 7S model is applied to the Soaksy product and company:
Skills & Stuff Our team consists of five very motivated students. We are all from different study fields. The five study fields in our team are: Electrical and Computer Engineering, Industrial Engineering, Civil Engineering, Applied Mathematics, Industrial Design and Product Development. Also, we are from five different European countries. This means there are a lot of cultural similarities between us, but also some differences. When we talk about the product, we must take into account the possible environmental opportunities:
- The Soaksy helps to collect floating trash that pollutes a lake.
- The Soaksy can use sustainable energy.
- The Soaksy is made of sustainable materials.
Also the technological threats:
- The Soaksy is not fully automated. It has to be emptied every once in a while.
Strategy The main strategic objective of our team is to create the project in a limited time: From the 17th of February to the 23rd of June without own resources. These objectives are therefore not long-term. It can be considered a weakness because some parts of the report have not been analysed as thoroughly as could be. One objective is to find sponsors for our product. Also an objective is to find out where there the gaps are in the reach of the current market and to make space between well-known established companies.
Structure The team is organized by assigning tasks according to the capabilities of each team member. We do not have a team leader, so each point is discussed with the team and must be accepted by all members. This structure creates equality between team members. The team is also aware of possible outcomes or misunderstandings.
Systems In this point we are going to analyse and measure the procedures and processes that the team has to carry out. To discuss the progress done each week, the team has a meeting with the teachers to fix some problems and keep doing the initial Sprint plan. Teacher's feedback helps to adjust the tasks which improve doing the project.
Management Style We follow the Agile methodology that consists of knowing what each team member is doing during the week and communicating to know how the project is progressing. Decisions are made by all team members in equal circumstances. If some team members have a problem, this will be communicated to the team and it will be possible to help.
Shared Values In order for the project to succeed, our team has common and important values. The team is motivated and multicultural and works to preserve ethics. These ethics and values make us stand out and help us make our final decisions.
4.3 SWOT Analysis
SWOT stands for Strengths, Weaknesses, Opportunities and Threats. The main proposals of SWOT analysis are to identify internal or external factors that are favourable or unfavourable for the viability company/product. This framework is very useful at the beginning of the project to support plan strategic exercises visualizing possible opportunities and uncover threats. SWOT analysis is built by internal diagnostic which consist on analysing strengths and weaknesses of the inner company and external diagnostic that analyses the outside environment opportunities and threats.
The SWOT Matrix Analysis is created from the macro-environment (4.2.1) and the micro-environment (4.2.3).:
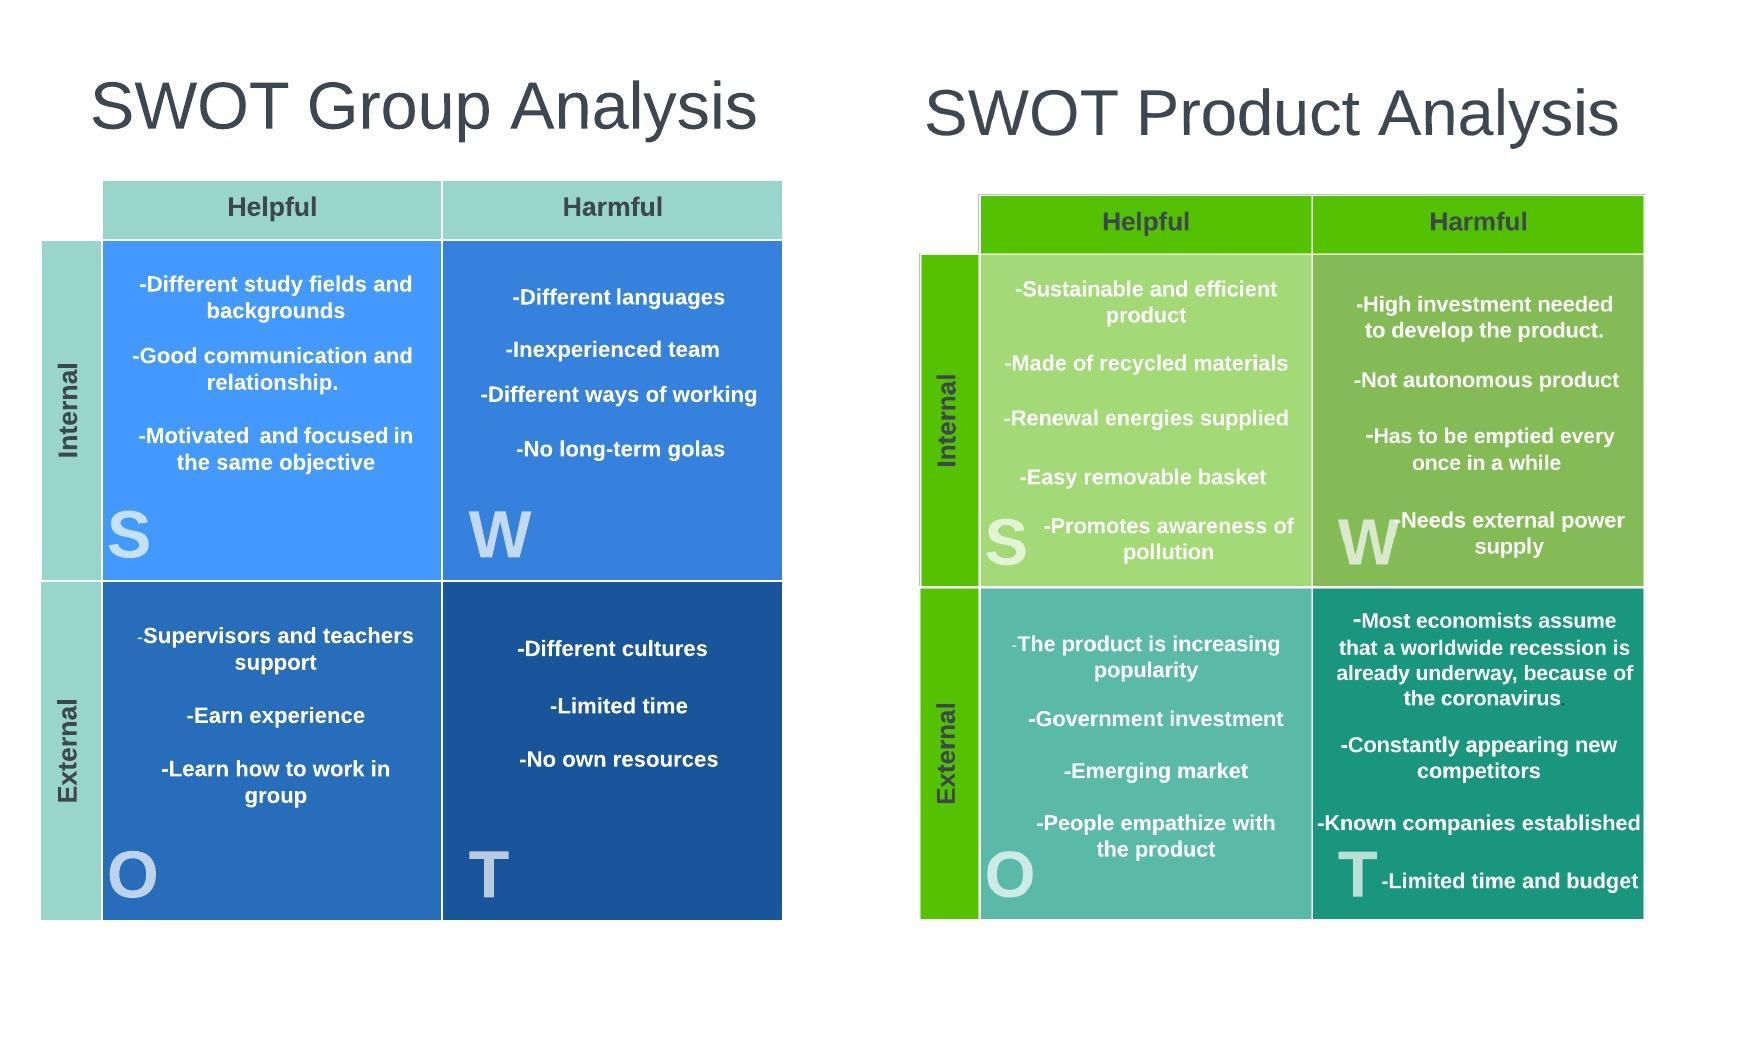
From the SWOT product analysis, we can conclude that the costumer's awareness of the current situation of polluted waters makes it easier to get sponsors or government investment. This point helps against the high investment that is required to develop the product. However, being in an emerging market there is the threat of constantly appearing new competitors and get a gap in the market between well known companies established like The Ocean Cleanup or The SeaBin Project.
4.4 Strategic Objectives
Marketing strategic objectives are an important part of a marketing plan. Without defined objectives, the marketing plan is unclear and it is very difficult to achieve an unclear plan. For creating a clear marketing plan, the SMART principle is used [K. Kosaka, n.d.].
- “S” – Significant/ Stretching/Specific: What is going to be achieved with reference to marketing goals? Target a specific area for improvement with clear and understandable language.
- “M”- Measurable/Meaningful: Objectives should be defined by quantified or qualified parameters to monitor progress and measure results so that final results can be replicated and evaluated.
- “A” – Achievable/ Attainable: It is important to make sure the goals and steps that are going to be realized are achievable knowing the existent limitations, time and resources.
- “R” – Reasonable/ Realistic,/Relevant: Defining our priority tasks and objectives in accordance with the long-term plans established. Focus on ethical values.
- “T” - Time-based/Timely: The goals should be reached in a limited time. This limited time is determined based on being aware of the possible outcomes and the difficulty of each goal.

The main strategic objectives for Soaksy product will be:
- Create the redesign leaflet and flyer product by the teachers feedback before the 8th of April 2020.
- Finish testing phase before June 2020.
- Build 3D Soaksy's prototype before the 20th of June 2020.
- Create a long-life power supply system before the 15th of June.
- Revise and finish the project report before the 15th June of 2020.
- Develop an economically sustainable product by using renewable energy.
- Make life product cycle as circular design after product life.
- Find sponsors and funding to the business by the end of 2020.
- Popularize and promote Soaksy by media advertising.
- Establish Soaksy's company before August 2021.
- Create a business website and online sales at the end of 2021.
- Make a platform for feedback users at the end of 2021.
- Start Soaksy selling in European countries at the end 2022.
- Expand selling all over the world at 2025.
4.5 Strategy/Targeting/Positioning/Brand
4.5.1 Targeting
Our target group consist of local governments in Portugal, because the local governments decide whether to place a product in a public environment, such as a lake. Moreover, local governments want to guarantee clean public spaces for their citizens. The Soaksy could help by this. Also, we would like to seek contact with NPO’s, because they can serve as our supporters when we want to sell the Soaksy to a local portuguese government.
4.5.2 Strategy and positioning
In order to know the real market competitors, the more comparable products have been analysed to identify the gaps in the market and to take advantage of the possible opportunities. To visualise the market scope and to define the position of our product, the product perceptual map has been made.
The product perceptual map makes a comparison between sustainability and price with the established products on the market. Our positioning strategy is aimed at obtaining an attractive product that stands out for its low price and sustainability. Soaksy is a product that requires low power supply and low maintenance. The perceptual map for the product is shown in Figure 20. The perceptual map shows the value position and the values on which we want to specialise. The main value is sustainability, our product is made of recycled materials. Being loyal to our vision of promoting awareness of polluted waters, the Soaksy is made of recycled materials and is powered by renewable energy sources. This gives an extra value that is appreciated by the potential customers and makes Soaksy's brand high positioned compared to its competitors.
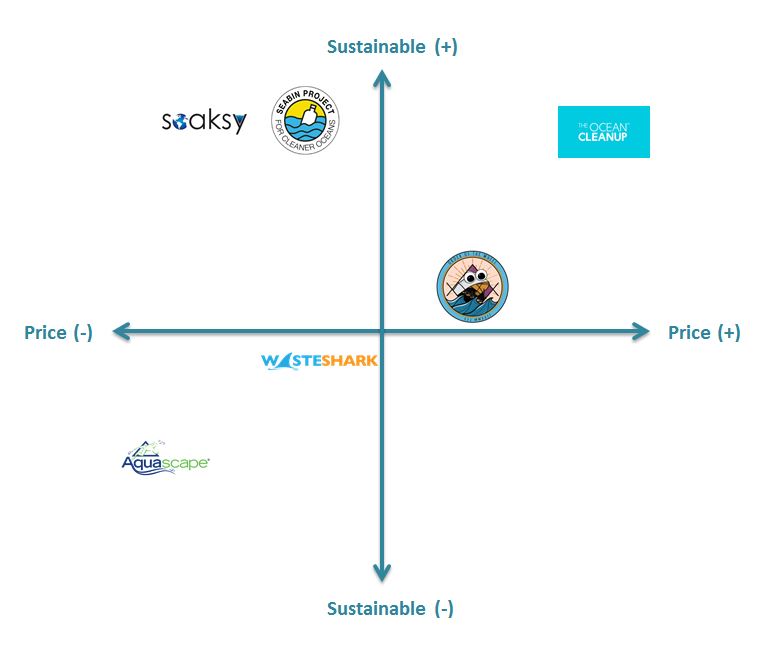
Also, a comparison table is created in Table 19 to compare different floating trash collectors in energy use and price range.
| Seabin | Water shark | Mr. Trash Wheel | Pond Skimmer | Ocean cleanup | Soaksy | |
|---|---|---|---|---|---|---|
| Green energy | If available can use energy from sustainable sources; in most cases Grid [Global Opportunity Explorer, 2018] recyclable material | Solar power to charge batteries [Olga Koltsova, 2017] | Water flow energy [Waterfront Partnership, n.d.] | There are no specific data on the implementation of a sustainable practice | Ocean cleanup: Solar energy and wind energy [The Ocean Cleanup, 2019]. | Recyclable materials, low mantenience and renewal energy supply. |
| Price range | from 3300 € up to 6300 €, depending on location [Mariel Myers, 2018] | from 15 500 € up to 20 000 €, depending on the model [Esan Swan, 2018] | Mr Trash Wheel: 90 000 € per year [Alexander Tullo, 2018] | from 300€ up to 500€ [97] | 12.7 milion € [98] | from 500€ up to 1000€ |
4.5.3 Brand
For our product we choose the name “Soaksy”. Firstly, because it is a short and catchy name. The second reason is that our product will be used in the water and thus will get “soaked”. Thirdly, our product will use a pump that “sucks” the water that gets inside the bin and the word “sucks” sounds a lot like the word “soaks”.
In the design of our logo, we want to show that our Soaksy has to do with the world's water environment. That is why we choose to change the “O” of Soaksy into a world and highlight the waters. Also, we placed some water on the “Y” of Soaksy. In Figure 21 the Soaksy logo is shown.
The brand name Soaksy and the website soaksy.com are still available [Brandbucket, n.d.].
4.6 Adapted Marketing-Mix
The Marketing Mix or 4ps is a combination of four instruments – Product, Price, Place and Promotion- with which a team can influence a marketing strategy. The Marketing Mix can be used for developing a marketing plan for an existing product or a new product concept. It can be used as a checklist for short-term decision-making and it is requires information from previous phases to develop an accurate decision for each point. The Marketing Mix starts with the positioning statement for the new product, including information about the target market and competitive advantage. The Marketing Mix consists of the 4 P's and helps a company to find the right combination of factors to provide value to its target customers [OER Services, n.d.].

The Soaksy Marketing Mix consists of the following 4 P's:
Product - Features, branding, packaging and assortment.
The goal of the Soaksy is to automatically and continuously collect floating trash in lakes. The Soaksy will do this by collecting the water and the trash using a waterfall movement. A sensor is used to see when the trash bin is full. When the bin is full, an alert is sent to the employee who is in charge of emptying this Soaksy.
The design of the Soaksy is quite similar to a regular trash bin. But there are some differences between a regular trash bin and Soaksy. Firstly, a regular trash bin has a trash bag and Soaksy has an inner bin. Secondly, a pump is attached at Soaksy’s bottom. This pump keeps the inside of the bin almost empty of water. A regular trash bin does not need a pump, because people throw their trash into it themselves. Thirdly, the Soaksy has three floaters attached to the top. These floaters make the Soaksy float in the lake. Finally, there is a sensor attached to one of the floaters. This sensor checks if the Soaksy is full. Soaksy’s design is shown in Figure 23. The Soaksy’s height is approximately 65 cm, the maximum diameter of 82 cm and the diameter of the top of the inner bin is about 30 cm.

Based on the product perceptual maps can be concluded that the Soaksy differentiates itself from competitors by its low price and sustainability. Furthermore, Soaksy’s values stands out. When the Soaksy is not working anymore, the customer can reach the Soaksy company via email or phone. The Soaksy will be picked up for free and the usable parts will be recycled.
The material that will be used to elaborate the packaging will be PVC (rigid, molding and extrusion). The criteria we followed for the selection of the material was a circular design, waterproof, recyclable, non-toxic, and resistant to the degradation of the sun and possible adverse weather conditions. The packaging will use the PVC collected in the floating trash to create each Packaging. The first series of products will be made of non-recycled PVC. The hexagonal structure of the packaging provides stability for later use as a waste container and thus gives it a second life. On the back of the packaging, there will be small slots where water will filter out in case of rain. Our product will be powered by a 67x77x3 solar panel which will be purchased from another company and then sold together. This solar panel and the other components will come with their respective cardboard packaging.

Price - Retail price and price structure.
The exact price of the Soaksy is unknown yet. The materials used for the prototype cost around €200 (see 7.4 Final list of components). We want the price of our product to be low, so that even poorer cities can afford it. The estimated price for the Soaksy is now €500. A similar product is the Seabin from the Seabin Project. The Seabin price ranges from €3300 to €6300 [Mariel Myers, 2018]. Out price should not be too low because people might think the quality is not good so we created a range of price between similar prodcuts like Seabin and pomp skimmer which allows us to maniobrate the price among 500 to 3000 euros, to distinguish of our close competitors we will keep the price of 1000 euros.
Promotion - The target audience, communication media, message, objectives and budget
One of the strategic objectives is that the Soaksy company should be established by the end of 2021. This means, having social media accounts, website, phone number, email address and even our first customers. The reason to have a powerful promotion is to make known our brand. The Soaksy company will seek contact with local governments in Portugal and with NPO's by phone and email. Also, we will use the website soaksy.com and the free social media, such as LinkedIn, Facebook, Instagram and Twitter, to promote the Soaksy. The two main websides that we are going to focus on are Facebook and Instagram. To explain how the Soaksy works and what advantages the Soaksy has, we will create a promotion video and make it available on our website and social media accounts. The specific objectives to promote Soaksy in the first and second year on the market will be:
- Reach at least 10.000 followers in each media to have a good communication and be known for our target group.
- Official webpage
- Media advertisement, in order to obtain more demand.
- Establish a powerful image of our brand and promote our values and quality.
Place – The place to sell
The Soaksy company will sell the product online at soaksy.com. Our phone number and email address will also be available on our website and social media accounts. Via these communication mediums, (possible) customers can ask questions and order the Soaksy. The Soaksy will be only available in Portugal. One of our strategic objectives is to expand our market to other European countries by the end of 2022.
4.7 Budget
Our marketing budget is needed to promote the Soaksy. Marketing can be done via online advertisement, posters, flyers, folders, videos and fairs. Nowadays, for promoting a product we need a good social media communication and featured YouTube advertisement to get the attention of our potential customers. Facebook, Instagram, Twitter, Snapchat, LinkedIn and other social networks will keep the attention to possible customers that want to collaborate and contributing in capital in the project in platforms like Kickstarter. We want to have a good persusive marketing in the media to obtain a reputation and strenght for the company.
Our potential customers are public institutions. By getting publicity on social media and creating our own company page, the chance that sponsors will find us and invest in our company increases significantly. We have an initial cash contribution from each team member for possible expenses. The incomes and expenses for marketing are shown in Table 20.
| Incomes | Price (€) |
|---|---|
| Kickstarter Platform | 12000€ |
| Initial capital for each member of the team (500€x5) | 2500€ |
| Initial Sponsors | 10000€ |
| Total | 24500€ |
| Expenses | |
| Leaflet design | 200€ |
| Official page | 1000€ |
| Hosting | 60€/year |
| Advanced Seo positioning | 280€/month |
| Instagram advertising | 600€/month |
| Facebook advertising | 600€/month |
| Total | 2740€ |
4.8 Strategy Control
According to Kotler: “Marketing control is the process of measuring and evaluating the results of marketing strategies and plans and taking corrective action to ensure that marketing objectives are attained.” [S. Ghose, n.d.]. To achieve this, we need to continuously improve our product and processes. We choose to use the method PDCA: PLan-Do-Check-Act/Adjust [J. Bosgra, n.d.].

- Plan: Consists on assessing the current situation and evaluate and predict what issues and outputs may be and plan how to fix it. Establish an agreement about what methodology is going to be followed until the end of the project, in this case Agile, and make sure the objectives and goals are understood by all team members. Avoid big changes during the process only when it's completely necessary and analyse and predict the results.
- Do: In this phase, by executing the action of the previous step, we will execute the plan to test potential solutions and build a process to achieve our goals, while gathering data for further analysis.
- Check: We will check and make a retrospective about the correct applied methodology plan. We will study the results collected and compare its effectiveness to decide which solution will be implemented and support for achieve our goals. We will continue testing until we have viable results that suit our expectations.
- Act: The final step, once the past mistakes have been identified, is when the corrective actions are made. It allows the method be redefined anew in the future and be used for continuous improvement operations. If the results are successful, the process can be standardized. If not, the team will focus on the issues and repeat the cycle until obtain the proper solution.
4.9 Conclusion
Based on this market analysis, the team decides to create a floating trash collector intended for governments and people interested in reversing the current water pollution situation. the team have defined the main strategic objectives and analysed the possible threats and opportunities to develop our product and predict future issues. This is why the team decided to create Soaksy by using recycled materials and using renewable energy, which gives an extra value that is appreciated by customers and positions the Soaksy brand high above its competitors. Our positioning strategy is aimed at obtaining an attractive product that stands out for its low price and efficiency. It is a product that does not need a high power supply and requires little maintenance. To promote the product, the team will invest in social media advertising to attract potential customers who want to participate and contribute to our project.
In the next chapter, study the necessary sustainable measures to take into account in the product will be studied.
5. Eco-efficiency Measures for Sustainability
5.1 Introduction
Sustainability is a complex concept. The most often quoted definition comes from the UN World Commission on Environment and Development: “sustainable development is a development that meets the needs of the present without compromising the ability of future generations to meet their own needs.” In the charter for the UCLA Sustainability Committee, sustainability is defined as: “the physical development and institutional operating practices that meet the needs of present users without compromising the ability of future generations to meet their own needs, particularly with regard to use and waste of natural resources. Sustainable practices support ecological, human, and economic health and vitality. Sustainability presumes that resources are finite, and should be used conservatively and wisely with a view to long-term priorities and consequences of the ways in which resources are used”[UCLA Sustainability, n.d.].

5.2 Environmental
Environmental sustainability is the rate of use of renewable resources, avoid using non-renewable resources and create as little pollution as possible. If resources cannot be used indefinitely, then they are not sustainable. When all three pillars of sustainability are solid, people live in a system where high quality life is the norm. They have a clean and healthy environment, a decent level of economic well-being and a solid level of social achievement [Thwink, 2019].
Therefore, in accordance with the above reasons, it was essential for this project to use environmentally friendly and respectful materials, such as natural materials or materials that could be easily recycled/reused. However, the materials used shall meet the characteristics required to withstand moisture.
The lakes and ponds that exist in urban spaces are places where the effects of pollution are easy to reach, but it is not so easy to remove. The project is intended to tackle this specific problem by implementing a system that collects waste on the surface of these same lakes.
The team decided to feed Soaksy also with a solar panel, as well as with traditional methods, making it a hybrid product and usable in adverse weather conditions. The solar panel absorbs sunlight as a source of energy to generate electricity or heat. Abundant solar energy in all countries of the world. From the point of view of energy security and sustainability, it seems logical to make the most of available solar energy technologies, and when not available Soaksy can continue to clean the lakes, minimizing greenhouse gas emissions and the use of non-renewable sources.
5.3 Economical
Economic sustainability is the ability of an economy to sustain indefinitely a certain level of economic production. In a sustainable economy, growth strengthens competitiveness, nature protection and the reduction of environmental impact. Nowadays, society does not respect the environment, most countries in the developed world simply pollute and eventually ruin in the name of profit, for example when a company has a high pollutant factor it can pay more taxes to get everything back on track. This solution is economically advantageous but disastrous for the environment.
The team intends to use local materials, if possible recycled materials, that comply with environmental regulations.
Our team has decided to focus (in addition to GDP) also on the environment trying not to weigh on it, creating a product (Soaksy) that cleans lakes from floating garbage and hopes to help create a common environmental awareness.
5.4 Social
Although for most people sustainable development only means nature protection, a further pillar of this concept was the social dimension. The social dimension is focused on improving social equality. If all make a small effort towards sustainability everyone will also benefit from it, for example a cleaner air or being able to swim in the clean lake near home.
The Soaksy is also meant to be an educational tool, reminding people that such a product is necessary because there is garbage to remove in the first place.
legislation: Maximum CO2 of 1250 parts per million (ppm) according to Portaria n.º 353-A/2013 [MINISTÉRIOS DO AMBIENTE, 2013]
recommendation: The National Institute for Occupation Safety and Health (NIOSH);the level of CO2 should never rise above 1 000 ppm [co2 levels at home, 2017]; the National Sleep Foundation (NSP) - the humidity level should always be kept between 30 % to 60 % [sleepfoundation.org, ].
5.5 Eco-Efficiency solutions
The term eco-efficiency was coined by the World Business Council for Sustainable Development (WBCSD) in its 1992 publication “Changing Course”. This concept describes a vision for the production of economically valuable goods and services while reducing the ecological impacts of production. In other words, eco-efficiency means producing more with less [R. Sardá, S. Pogutz, 2019].
According to the WBCSD, critical aspects of eco-efficiency are:
- A reduction in the material intensity of goods or services
- A reduction in the energy intensity of goods or services
- Reduced dispersion of toxic materials
- Improved recyclability
- Maximum use of renewable resources
- Greater durability of products
- A increase in the service intensity of goods or services
5.5.1 Environmental Management System (EMS)
An EMS is defined as the organizational structure, responsibilities, practices, procedures, processes, and resources for implementing and managing an organization’s environmental affairs while ensuring conformity to its policies, standards, and stakeholders’ expectations.
The team decided to use this system as it can help identify where eco-efficiency opportunities occur within a company [WBCSD, n.d.].
5.6 Life Cycle Assessment
Life-Cycle Assessment is a decision-making tool to identify environmental burdens and evaluate the environmental consequences of a product, process or service over its life-cycle from cradle to grave or cradle to cradle in the case of products that can be recovered and recycled or reused, such as our product. [http://wbcsdservers.org/wbcsdpublications/cd_files/datas/capacity_building/education/pdf/EfficiencyLearningModule.pdf]
The company responsible for making the product must apply a Life cycle Assessment based on the theory of Circular Economy, as shown in Figure 27.

5.6.1 Resources
The materials to be used must respect existing environmental regulations and make use of local resources.
An optimal source of resources will be recycled materials, such as PET plastic, the plastic most used with food products, and the most easily recyclable.
As far as electronic components are concerned, it would be ideal to make agreements with local manufacturers and stores in order to have the cheapest possible material remaining local.
5.6.2 Processing
The processing of resources would have to apply techniques with minimal environmental impact.
Examples of techniques would be to use efficient renewable energy technologies and also use as few processing steps as possible.
5.6.3 Manufacturing
The manufacture will be done with as few people as possible, using machines and specialized labor for this purpose.
The result of this manufacture will be a product that still has to be adjusted to the place of application. The person who will make the final adjustment will have to have some technical degree.
5.6.4 Distribution
The distribution of this product should start in the country of origin, expanding to other countries if the demand justifies.
The transportation will be done by a company under contract from the warehouses to the place of application.
The packaging of the product will be made of cardboard, of recyclable reference.
5.6.5 Use
The product is made to last for years, with minimal emissions during this time.
The product implements a system that allows it to be powered by solar energy during most of its operation, reducing the environmental impact and providing the user with energy savings.
5.6.6 End of life
At the end of the product's life, the user should contact us to collect the product at no cost to the user.
With the product, the team would use all recyclable materials to turn into resources for new products.
The electrical materials would be reconditioned for new products if possible.
With all non-recyclable and non-repairable materials, it would be dispense according to the regulations.
5.7 Sustainability report
Sustainability report is defined as an organizational report that gives information about economical, environmental and social performance. Our team has a preference for independent researchers investigating Soaksy's sustainability. An independent study shows more transparency towards the (future) customer. Our sustainability report will contain the following topics.
Social:
- Company history.
- Comparison with competitors on the market.
- Progress made in the past year.
- Conducted sustainability research.
- Actions to ensure the safety of our employees and the results of our actions.
Economical:
- Shareholders introduction.
- Shareholders expectations .
- Plan to meet shareholders' expectations.
Environmental:
- Footprint analysis
- Life cycle assessment.
- Plan to improve Soaksy's reusability.
5.8 Conclusion
Based on the sustainable study carried out, the team chose to use stainless steel for the rigid structures and PET plastic for the waste container. These materials are easy to recycle and have a long lasting effect, two essential characteristics for our product.
6. Ethical and Deontological Concerns
6.1 Introduction
Ethical and deontological concerns are influencing the entire society more and more. They are major key factors in each company. By neglecting these factors and counting them as irrelevant, it can affect a business very negatively. In this era of social media, all kinds of news spread quickly. Especially negative news. A morally wrong case can have a great relevance worldwide, and very quickly impact on the reputation of the involved company. When this happens people lose confidence in society and this could degenerate into a decline in sales and stock market. Therefore, general ethical and deontological concerns should not be overlooked, as these could become key factors in a business relapse.
In this chapter there will be analyse the five main ethical and deontological concerns. These are ethical issues of engineering, sales and marketing, academic concerns, environmental impacts and responsibilities. It is essential to pay equal attention to every principle. These ethical concerns must be respected in order to provide the highest quality and to protect the environment, customers, workers and maintain the reputation of the company.
6.2 Engineering Ethics
Engineers have a great impact on the lives of the people on this planet. The people working in this sector are involved in the design, analysis and construction of infrastructures, machines, devices, etc. which condition the quality of life and health of the people who use them during their daily lives. It is therefore very important that these professionals behave in a good ethical and moral way.
Engineers play an important role in today’s society, conditioning our lives in three different ways [NSPE, 2019]:
- Human: Engineers should develop and create products in line with the safety, health and well-being of the public.
- Environment: Engineers should develop and create products that are environmentally friendly, or that are as environmentally friendly as possible. Studying the product life cycle. This is one of the greatest challenges of this century, as our society faces climate change.
- Society: Engineers should develop and create products for the benefits of the whole society and contribute to a better society, creating solutions to connect, or help people.
Code of ethics was discussed in many engineering societies. The one that was the more up to date is the Code of Ethics brought by the National Society of Professional Engineers (NSPE).
Engineers, in the fulfillment of their professional duties, shall [NSPE, 2019] :
- Hold paramount the safety, health, and welfare of the public.
- Perform services only in areas of their competence.
- Issue public statements only in an objective and truthful manner.
- Act for each employer or client as faithful agents or trustees.
- Avoid deceptive acts.
- Conduct themselves honorably, responsibly, ethically, and lawfully so as to enhance the honor, reputation, and usefulness of the profession.
6.3 Sales and Marketing Ethics
Every company that enters the market must interact with a constant competition for everything it seeks at its internal resources, customers, price. In order to win as many of these clashes as possible, companies carry out different activities, using tactics and campaigns. The constant presence of competition within the market inevitably leads to a clash between different players. These clashes can sometimes lead to unprofessional behaviour such as price competitions, branding wars and the use of unfair practices. To avoid this phenomenon, one can use ethical marketing. This is not a real strategy, but is more a school of thought in which responsibility, equity and honesty are promoted.
There are eight ethical marketing principles [Nicky LaMarco, 2018]:
- Truth and honesty are appreciated and respected in all types and marketing channels.
- Marketing personnel must be guided in their professional activity by their personal ethics.
- Advertising for your product should not be confused with news and entertainment.
- The marketers will be honest and transparent about who sponsors their products.
- Consumers must be treated fairly.
- Consumer privacy is appreciated and respected at all times and at all costs.
- Marketing must comply with rules and regulations issued by the government or organisations.
- Ethics should be discussed openly and honestly in all marketing decisions.
The team wants to make sure that the customer’s wishes and expectations are met, with a fair price. This means that the price should cover all the costs and also provide a profit for society. But it also means that customers can see where the price comes from and that they agree that they get the value for their money. Even if the goal is to keep the price as low as possible, the ecological footprint will be as small as possible. This will lead to the increase in the selling price, but it will provide added value to the product.
6.4 Environmental Ethics
Environmental ethics is a branch of ethics that studies the relationship between human beings and the environment and how ethics plays a role in this. Environmental ethics believe that human beings are part of society as well as other living creatures, which includes plants and animals. Plants and animals are a very important part of the world and are considered a functional part of human life. Therefore, it is essential that every human being respects and honors this and uses morality and ethics when it comes to these creatures [Rinkesh, 2019].
There are many different environmental ethics that could be held, ranging from the human-centred (or “anthropocentric”) to the more nature-centred (or “non-anthropocentric”) vision. Non-anthropocentrists support the promotion of intrinsic nature rather than instrumental or use value for human beings [Ben A. Minteer, 2017].
While the world's population has increased sevenfold in the last two centuries from 1 billion to more than 7 billion, consumption of the planet's natural resources has also increased. This behavior places great emphasis on the planet’s life-support capabilities [UNFPA, n.d.] [Andrew Light & Alan Holland John O'Neill, 2012].
Our team will try to apply the following points to the project to make it as sustainable as possible for the environment and to help our planet during the Anthropocene:
- Maximum efficiency with minimum energy consumption.
- Materials must be environmentally friendly.
- Reach maximum product life.
6.5 Liability
Companies willing to create and sell a product must confront themselves with the responsibility for their product. Liability is the legal aspect of the product, which prevents the company from being sued for damages or accidents caused by their product or its use. In order to avoid product liability issues, our team has decided to comply with the following EU directives:
- Machine Directive (2006/42/CE 2006-05-17): It concerns the danger that the machine might present to man: Explosions, vibrations, radiation, finger joints, dangerous substances in flight, force limits for the operation of machines, the minimum distance for safety, etc. [EU machinery legislation, 2019]. Following this directive Soaksy must meet the essential health and safety (RESS) requirements, that is to say, it must be:
- Built according to certain parameters;
- Marked and recognizable;
- Accompanied by a booklet (instruction manual for use and maintenance);
- Guaranteed by the manufacturer with the declaration of conformity.
If this list is carried out in full, the machine can be considered to conform to the EU market and be recognised with the CE plate.
- Electromagnetic Compatibility Directive (2004/108/EC 2004-12-15): This Directive regulates side effects between electronic components that interface with each other. These side effects may be electromagnetic radiation or fields in the vicinity of electronic components. The Directive provides that “the electromagnetic disturbances generated shall not exceed the level above which radio and telecommunication equipment (…) cannot operate” [EMC Directive, 2014]. All equipment generating electricity emissions in Soaksy must be CE marked.
- Low Voltage Directive (2014/35/EU 2016-04-20): Concerns the health and safety risks of electrical equipment with an input or output voltage of 50 V and 1000 V for AC and 75 V and 1500 V for DC [LVD, 2014]. The Directive covers electrical equipment with a supply or output voltage between 50 and 1000 V for alternating current (AC) or between 75 and 1500 volts for direct current (DC). It is important to underline that this Directive does not cover tensions within products, provided that the consumer cannot access them without using suitable tools; so if there are tensions bigger than these parameters within Soaksy, it must prevent the consumer from being able to access it unknowingly, covering these parts in such a way that it can only access them with appropriate tools and signalling the risk of electric shock on the surface of the enclosure.
- Radio Equipment Directive (2014/53/EU 2014-04-16): Soaksy is an “electrical product (…), which intentionally emits and/or receives radio waves for radio communication and/or radiodetermination purposes” [RED, 2014]. For Soaksy, it will be build radio equipment by the team, but it will also be used equipment already designed and built that are CE marked so as to be sure to insert a safe and usable throughout the EU.
- Restriction of Hazardous Substances in Electrical and Electronic Equipment Directive (2002/95/EC 2003-01-27): Prohibition of the use of lead phthalate, mercury, cadmium, hexavalent chromium, polybrominated biphenyls, polybrominated diphenyl ether, bis(2-ethylhexyl), butyl [RoHS 2, 2011]. All the components that will form electric and electronic Soaksy will have to be CE marked in order to avoid that the percentage of dangerous substances within them comply with the legislation.
Another fundamental point regarding the liability of the team is the created trademark, that should protect it and protect the team from misuse of our trademark, by registering it. Registration provides legal certainty and strengthens the position of the right holder, for example in the event of litigation[WIPO, ].
6.6 Conclusion
Based on this ethical and deontological analysis, the team chooses to focus on efficiency and high standards for each stage of the production process. The team chooses to work with sustainable materials and suppliers that guarantee adequate pay and rights to their workers. Advertising of the product must be truthful and lead to a sense of community for the protection and conservation of the lakes and the environment in general. The sales and marketing of the product should have the smallest possible ecological footprint, for example by using less polluting shipping methods. The team has decided that in the event of a malfunction in Soaksy, the product can be returned to the factory. Here the Soaksy will be repaired and the usable parts will be recycled. Soaksy will receive a two-year warranty.
In the next chapter, the project development will be introduced and described.
7. Project Development
7.1 Introduction
After research on the state of the art, the project managment, marketing, sustainability and ethical considerations, it is showed the steps followed to make and produce our prototype. In this chapter it will be explain the development of the project, starting with the black box to show the overall structure of the system in the most general way possible. After you can see the architecture with the cardboard model, structural drawings with the final design and electrical diagrams of the details.
7.2 Architecture
7.2.1 Black box Diagram
In Figure 28 the Black Box Diagram is shown.

The water flows the system in a waterfall movement, with the pump extracting the water that gets inside, and the trash accumulating the container.
The system uses sensors to measure the of the waste and level of the water inside the bin.
The waste level status and motor state is presented to the user via a webpage.
Finally, the water expelled by the water pump is returned to the lake again, passing through a temperature sensor that monitors the pump motor. When the sensor detects a temperature above 30 °C the system is programmed to switch off the engine. The 30 °C temperature limit is set by the water level sensor, which after this temperature can damage this sensor.
7.2.2 Technical Drawings
Figure 29 displays the technical drawing of the actual product. The prototype has a 1:2 scale. The main body's height goes up to 45 cm, and the maximum diameter, including the lower parts of the floaters, goes up to 40cm.

Figure 30 displays the arrangement of the bolts, nuts, and washers for the product.

7.2.3 3D model
Figure 31 displays the 3D model for this project. The figure shows all the components of the part that is going to be placed inside the water.

7.2.4 Electrical schematics
Figure 32 displays the Electrical Schematic of the system.

The system can be powered in two ways: by the electric grid or by a solar panel.
In the case of the photovoltaic panel it is necessary to have a converter that regulates the voltage and in the case of feeding with the grid it is necessary to convert AC from the grid to DC that the system will use.
These two ways have as output a voltage of 12 V DC and a Schottky diode as protection against electric current reversal.
This output will supply two converters, one from 12 V to 3.3 V and another from 12 V to 5 V, and will also supply the water pump motor.
The 3.3 V converter will supply the microcontroller, temperature sensor, water level sensor and part of logic level converter, while the 5 V converter will supply the other part of the logic level converter and the distance sensor, which measures the garbage level in the container.
The distance sensor has the particularity of requiring a logic level converter on the trigger and echo pins to interface with the microprocessor.
The microprocessor also interfaces with the water pump motor via a MOSFET, with a Schottky diode for inductance surge protection. The user can switch off the engine using an analog switch.
7.3 Components
In this chapter, it will be proceed with the study, research, and selection decision of the materials to be used in the theoretical implementation of the prototype.
This chapter is in line with the conclusions reached in previous chapters.
7.3.1 Comparison of materials
The essential specifications for the materials taken into consideration for the design of the product are shown in Table 21 below.
| Cork | PET | Stainless steel | Acrylic (PMMA) | PU/TPU | Nylon (PA) | |
|---|---|---|---|---|---|---|
| Production | Can be machined, routed, lathe-worked, cut using similar techniques to woodworking, and can be formed using a process like compression-molding plastics | As with other thermoplastics, PET can be injection molded, extruded and, as the number of bottles demonstrates, blow-molded. It can also be calendered into sheets. | Compared to other steels, stainless steel is versatile in terms of processing – it can be folded, bent, forged, deep drawn, and rolled. Standard grades are difficult to machine because of the hardness of the material, although specific grades are available that are much easier to machine. As a result of this versatility, it is suited to production volumes ranging from one-off to mass production. | In its granular form, PMMA is a versatile thermoplastic that can be injection molded and extruded. It is also widely available in a range of semi-finished rods, tubes and particularly sheets. | In order to understand the processing of PU, the various forms need to be understood. As a thermoset material – foams – it is limited to reaction injection molding. As a TPU, it is suitable for a range of production methods, including injection molding, compression molding, casting, extrusion, and also spraying. | It is difficult to extrude due to its low viscosity but is well suited to standard injection moulding. It can be spun into fibres, extruded for multilayer films for bottles, and is capable of being filled with materials including glass fibres to enhance its properties. Plasticizers can be used to increase flexibility |
| Sustainability issues | Cork trees absorb up to five times more CO2 than other trees while producing a new harvest of cork bark every nine years | In terms of the material, PETs represent one of the biggest areas of recycling, with the bottles being re-melted to make carpets, fibres, video cassette tape and as a filler for pillows and clothes: five two-liter PET bottles can yield enough fibrefill to make a ski jacket. PET is identified by the number 1 in the recycling symbol. | Recyclable. | Petroleum-based so not the most sustainable choice. However, PMMA can be reground, melted, and extruded into new products. | Low-temperature molding saves energy and is the most common form of reusing PU. Low-temperature molding is when the material is re-ground and bound together. | As a thermoplastic, it can be recycled; post-consumer PA is currently not recycled in large quantities but recycled postindustrial. |
| Cost | Relatively inexpensive | 1.46 €/kg | 3.59 €/kg | 2.86 €/kg | TPU: 2.86 €/kg | 2.86€/kg |
| Source | Portugal is one of the world’s biggest exporters of cork and accounts for 60% of the world’s production, producing over 300.000 tonnes a year. Spain, Algeria, and Morocco are also large producers. | Widely available from multiple global suppliers in both virgin and recycled forms. | Widely available from multiple global suppliers. | Widely available from multiple global suppliers | Widely available from multiple global suppliers. | Widely available from multiple global suppliers. |
| Key features | Poisson ratio of 0, Renewable, Biodegradable, Elastic, Vibration dampening, Shock dampening, Impermeable to liquids, Impermeable to gases, Good heat insulation | Excellent chemical resistance, Excellent dimensional stability, Tough and durable, Inexpensive, Excellent clarity, Good impact strength, Recyclable | Non-corrosive, Excellent toughness, Achieves a high polish, Difficult to cold work due to hardness, High-temperature resistance, High weight, High cost, Recyclable | Excellent clarity, Good hardness, Good stiffness, Resistant to weathering, Easy to color match, High print adhesion, Poor solvent resistance, Poor fatigue resistance, Recyclable | Excellent tensile strength, Excellent toughness, Excellent flexibility, Excellent abrasion resistance, Excellent cut resistance, Excellent chemical resistance, Good resistance to weathering, High flex life, Good impact strength, Generally not recyclable | Low friction, Excellent resistance to abrasion, High strength, High temperature resistance, Blends well with other materials, Poor moisture resistance, Limited chemical resistance, Recyclable |
Despite its biodegradable and impermeable properties, cork cannot be easily integrated with other parts (made out of other materials, such as plastic or steel).
For the main body, PET is a good solution because it is tough, durable, and inexpensive.
For the parts exposed to the Sun, one of the most UV resistant plastics would be used. Polymethyl Methacrylate, known as acrylic, is one of the most common plastics used in outdoor applications.
When it comes to the metal components, stainless steel will be used, due to the product's environment.
The mesh bag is made out of nylon.
In table 22, each non-electrical custom made component is described, along with its specifications.
| Component | Material | Mass | Material cost | Final price |
|---|---|---|---|---|
 | PET | 11.91 kg | 1.46 €/kg | 17.38 € |
 | PMMA | 0.81 kg x 3 | 2.86 €/kg | 6.94 € |
 | PMMA | 0.06 kg | 2.86 €/kg | 0.17 € |
 | TPU | 0.58 kg | 2.86 €/kg | 1.65 € |
 | PMMA | 0.63 kg | 2.86 €/kg | 1.80 € |
 | PU | 0.01 kg x 3 | 2.86 €/kg | 0.08 € |
 | PU | 0.09 kg | 2.86 €/kg | 0.25 € |
 | Stainless Steel | 26 kg | 3.59 €/kg | 93.34 € |
In table 23, each non-electrical component that can be directly bought is described, along with its specifications.
| Component | Material | Link | Price per unit | Final price |
|---|---|---|---|---|
  | Stainless steel | Bolt and nut | 0.03 € | 0.45 € |
 | Stainless steel | Spring washer | 0.02 € | 0.30 € |
 | Stainless steel | Flat washer | 0.02 € | 0.6 € |
 | PMMA | Nylon mesh | 8 € | 8 € |
 | Stainless steel | Nylon mesh | 6.85 €/5 meters | 0.685 € |
Summing up the materials in Table 22 and Table 23, the total is 131.645€ for the actual product. Having a 1:2 scale, the prototype's raw materials will be also divided by 2, resulting in 65.82€.
7.3.2 Brief description of the components in use
- Pump: The water pump positioned at the bottom of the submerged container is the main component of the project as it allows the floating garbage to move from the water surface into the container.
- Ultrasonic sensor detects when the container reaches maximum capacity. The information acquired by the sensor will be processed and sent by the microprocessor to an IoT platform.
- Water level sensor uses the water conductivity to determine the water level. This sensor is placed at the bottom and on the inside of the outer bucketto measure the internal water level. This parameter is important to keep the product stable, as well as to prevent the pump from running without water. If the water level is too low, the pump does not operate.
- Temperature sensor is placed at the water pump outlet to monitor the water temperature. If it detects a high temperature, it means that the pump is running dry. This sensor complements the water level sensor and is a safeguard in case it fails.
- Micro-controller is an integrated circuit that contains all the logical functions for processing sensor data, sending the system status to the IoT platform and controlling the operation of the water pump.
- Logical level converter is an electrically safe interface between the micro-controller and the ultrasonic sensor.
- MOSFET is the interface between the water pump and the micro-controller. The micro-controller controls the pump through the MOSFET.
- Analog switch allows the user to interface directly with the pump.
- Power circuit ensures the distribution of electricity from the power source to the electrical loads of the project (water pump, sensors, micro-controller).
- Power Supply AC/DC 12 V is the system's power source. The connection to the power grid is made via a AC/DC power supply, with an output voltage of 12 V. It employs a transformer to convert AC mains electricity into a lower AC voltage. Then a rectifier converts the AC output voltage of the transformer to a cyclic DC voltage, followed by an analog electronic filter to regulate the DC voltage.
- DC/DC converters are used with different purposes. Firstly, at the output of the photovoltaic panel at 12 V there will be a step-down, or buck, switching converter. Secondly, to convert 12 V from the grid conversion or photovoltaic panel into lower voltages to power the micro-controller and sensors, a low-dropout (LDO) voltage linear regulator will be used.
- Power diodes are added to prevent power back feeding conversion to regulated 12 V DC in both power sources.
- Photovoltaic panel will feed the project during the day, converting solar photons into electrical energy through the photovoltaic effect. The panel was ncorporated in the project to make it more independent and sustainable.
- Bird repeller was integrated to protect animals, mostly birds from dangers that may occur when these interact.
7.3.3 Pump
The water pump will be the main component of the system.
Therefore it is necessary to carry out a study to select the most suitable pump.
In this study it will be consider two aspects: the type of power supply (DC vs AC) and the environment where they operate (Submersible vs Surface).
7.3.3.1 DC vs AC pumps
In order to carry out the process of choosing the water pump, it will be necessary to decide what type of supply such a pump will have.
In Table 24 water pumps with AC supply and DC supply are compared.
The water pump should have the following characteristics:
- Be as quiet as possible so as not to disturb people and animals;
- Long life span to ensure costs;
- Efficient to reduce the energy consumption of the system.
These characteristics are fulfilled by DC-powered water pumps.
| Type | Efficiency | Noise levels | Price | Lifetime |
|---|---|---|---|---|
| DC | More efficient and so requires less solar panels to operate | Less noisy | More expensive | Has a longer life as it uses motor coils manufactured from pure copper |
| AC | Less efficient | Noise will increase with usage | Less expensive | Uses motor coils manufactured from aluminum/copper to achieve competitive prices |
7.3.3.2 Submersible vs Surface pumps
Water pumps can be divided into where they are placed: submersible and surface. Table 25 holds the advantages and disadvantages of each type of pumps.
Considering the requirements of the system, submersible pumps are the most suitable, as they present:
- Less noise and visual impact on the environment since they are located below the water level;
- Greater energy efficiency because less work is needed to move the water and suffer from less overheating.
| Type | Pros | Cons |
|---|---|---|
| Submersible | Submersible pumps may be less complex or more energy-efficient. Capable of raising water from a greater depth - i.e. over 7 m. No priming problems. Less noise. No overheating of the motor. The pump is not seen. | A submersible pump is more expensive to buy since it needs required waterproof casing. Submersible pumps are located inside the tank, and so some dismantling is required before accessing the pump. Waterproof Seals can corrode over time allowing water to get into the motor. This seal also makes motor access and repairs more difficult. |
| Surface | More accessible, easier to examine and work on. Offer greater pressure than pumps which are submersible. | Can be very noisy, even those that claim to run very quiet. Need covers to protect the pump from weather, reduce the noise and to look nicer. Surface-mounted pumps are not as shielded from their surroundings. |
7.3.3.3 Options and choice of water pump
After choosing the type of supply and location, it is now possible to search the market for water pumps with such characteristics. The market product search can be found in Table 26.
| Name | Description | Price (€) | Photo | Seller | Local of export | Weight (kg) | Manufacture guide |
|---|---|---|---|---|---|---|---|
| Velleman VMA421: Water Pump | Input: 12 V DC Max. current: 0.35 A Consumption: 4.2 W Max. flow: 240 l/h Acoustic noise: <40 dB Working time: > 30 000 h(can continuously work) Dimensions: 51 x 34 x 42.7 mm | 12.20 |
| Aquário | Portugal (Aquário store) | 0.08 | Velleman |
| TMC 06302 | Input: 12 V DC Max. current: 1.5 A Consumption: 18 W Max. flow: 378 l/h | 13.73 + 7.99 (transport fee) = 21.72 |
| Motamarine | Portugal | - | TMC |
| TMC 04301 | Input: 12 V DC Max. current: 2 A Consumption: 24 W Max. flow: 380 l/h\\Note: Max. continuous operation should not exceed 15 min. | 12.89 + 7.99 (transport fee) = 20.88 |
| Motomarine | Portugal | - | TMC |


The best water pump available in the Portuguese market to implement in the prototype is be “Velleman VMA421: Water Pump”.
The reasons for this choice are the following:
- The cheapest pump was chosen, because it does not matter the capacity of the pump for the prototype phase.
- It presents detailed information about its characteristics.
7.3.4 Distance sensor
Table 27 contains the research on the sensor that will measure the level of waste in the bin.
| Name | Description | Price (€) | Photo | Seller | Local of export | Weight (kg) | Datasheet |
|---|---|---|---|---|---|---|---|
| JSN-SR04T-2.0 Ultrasonic Waterproof Range Finder | Operating voltage: 5 V DC Static current: 5 mA Operating current: 30 mA Operating range: 25 cm to 4.5 m Resolution: 0.5 cm Detecting Angle: <70 ° Operating Temperature: -10 to 70 °C Cable Length: 2.5 m Dimension: 41 mm * 28.5 mm | 16.50 |
| botnroll | Portugal | 0.054 | JSN-SR04T-Datasheet.pdf |
| Adjustable Infrared Sensor | Power supply: 5 V Control Output: 100 mA Circuit. Consumption: <25 mA Response time: <2 ms Direction: ≤15 ° Range: 3 to 50 cm adjustable for opacity and transparent objects Shell material: plastic Sharp: 30 mm (length) x 20 mm (wide) x 13 mm (thickness) with a 45 cm lead wire. | 8.95 |
| botnroll | Portugal | - | dfrobot |
| HC-SR04P Ultrasonic Range Finder 3.3 V to 5 V | Working Voltage DC 3.3 V to 5 V Working Current 2 mA Working Frequency 40 Hz Max Range 4.5 m Min Range 0.02 m Measuring Angle 15 degree Trigger Input Signal 10uS TTL pulse Ranging accuracy 3 mm I/O pins are 5 V and 3.3 V compliant | 3.69 |
| PTRobotics | Portugal (PTRobotics store) | - | sparkfun Shares the same datasheet as the previous version (HC-SR04) |


Two types of sensors were considered for the sensor choice: ultrasonic and infrared.
One of the requirements of the sensor is that it is water-resistant, the only sensor listed in our survey with such a feature is the “JSN-SR04T-2.0 Ultrasonic Waterproof Range Finder”.
7.3.5 Water level sensor
Table 28 contains the research on the sensor that will measure the level of water inside the bin.
| Name | Description | Price (€) | Photo | Seller | Local of export | Weight (kg) | Datasheet |
|---|---|---|---|---|---|---|---|
| Water Level Sensor | Input voltage: 3 to 5 V Working current: <20 mA Output voltage: 0 ~ 2.3 V (with the sensor completely soaked in water) Operating temperature: 10 °C to 30 °C Humidity: 10 % to 90 % (without condensation) Analog sensor Detection area: 40×16 mm Dimensions (LxW): 60x20x8 mm | 2.90 |
| eletrofun | Portugal | 0.0036 | - |

Given the reduced variety of this type of sensors, the cheapest seller was chosen.
7.3.6 Temperature sensor
Table 29 contains the research on the temperature sensor for the outlet of the pump.
| Name | Description | Price (€) | Photo | Seller | Local of export | Weight (kg) | Datasheet |
|---|---|---|---|---|---|---|---|
| WATERPROOF TEMPERATURE SENSOR (DS18B20) | Input voltage: 3.0 V to 5.5 V ± 0.5 °C accuracy from -10 °C to 85 °C Temperature range: -55 to 125 °C 9-12 bits of selectable resolution Stainless steel tube with diameter of 6 mm by 50 mm length Cable length: 2 m | 4.65 |
| botnroll | Portugal | - | DS18B20.pdf |

Due to the particularity that this temperature sensor needs to be waterproof and with a long cable, the DS18B20 sensor is the only option on the market that meets these conditions.
7.3.7 Microprocessor
Table 30 contains the market research on the micro-processors available on the market and compatible with the project.
| Name | Description | Price (€) | Photo | Seller | Local of export | Weight (kg) | Datasheet |
|---|---|---|---|---|---|---|---|
| Espressif ESP32 DevKitC-32D | Wi-Fi: Protocols 802.11 b/g/n (802.11n up to 150 Mbps) A-MPDU and A-MSDU aggregation and 0.4 µs guard interval support Frequency range 2.4 to 2.5 GHz Bluetooth: Protocols Bluetooth v4.2 BR/EDR and BLE specification Radio NZIF receiver with –97 dBm sensitivity Class-1, class-2 and class-3 transmitter AFH Audio CVSD and SBC. Hardware: Module interfaces. SD card, UART, SPI, SDIO, I2C, LED PWM, Motor PWM, I. 2S, IR, pulse counter, GPIO, capacitive touch sensor, ADC, DAC, On-chip sensor Hall sensor Integrated crystal 40 MHz crystal Integrated SPI flash 4 MB Operating voltage/Power supply 3.0 V to 3.6 V Minimum current delivered by power supply: 500 mA Operating temperature range –40 °C to +85 °C. | 13.60 |
| botnroll | Portugal | - | espressif |

The microcontroller research wass not extensive as the variety available on the Portuguese market that meets the project's requirements is reduced. The microcontroller needs to be low consumption and include a Wi-Fi connection module. So, with a brief research, it became clear that the development board “Espressif ESP32 DevKitC-32D” would be the most appropriate choice for the project.
7.3.8 Logical level converter
Table 31 contains the logical level converter considered to make the interface between the sensor and the microcontroller.
| Name | Description | Price (€) | Photo | Seller | Local of export | Weight (kg) | Datasheet |
|---|---|---|---|---|---|---|---|
| 3.3V & 5V Logic Level Converter | Input voltage: 3.3 V and 5 V Max. Drain-Source Voltage: 50 V Max. Gate-Source Voltage: ±20 V Max. drain current: 0.88 A | 2.50 |
| botnroll | Portugal | - | BSS138.pdf |

All logic level converters found are based on the FET BSS138, so it was choosen the cheapest option on the market.
7.3.9 MOSFET
Table 32 contains details of the MOSFET considered to interface the pump and the micro-controller.
| Name | Description | Price (€) | Photo | Seller | Local of export | Weight (kg) | Datasheet |
|---|---|---|---|---|---|---|---|
| BS170 - N Channel Enhancement Mode Field Effect Transistor | Continuous Drain Current Id:500 mA Drain Source Voltage Vds:60 V On Resistance Rds(on):5 ohm Rds(on) Test Voltage Vgs:10 V Threshold Voltage Vgs Typ:2.1 V Power Dissipation Pd:830 mW Voltage Vds Typ:60 V Voltage Vgs Max:20 V Voltage Vgs Rds on Measurement:10 V Operating temperature range: −55 to +150 °C | 0.31 |
| PTRobotics | Portugal | - | BS170-D.PDF |
| IRLZ44N N-MOSFET UNIPOLAR LOGIC LEVEL HEXFET 55V 41A 83W | Transistor type: N-MOSFET Polarization: unipolar Transistor type: HEXFET, logic level Source drain voltage: 55 V Drain current: 41 A Wattage: 83 W Source-port voltage: 16 V Resistance in driving state: 22 mΩ Connector thermal resistance – cover: 1.8 K / W Door load: 32 nC Operating temperature range: -55 °C to + 175 °C | 0.85 |
| botnroll | Portugal | - | irlz44n.pdf |


The selected MOSFET was the BS170. Although a MOSFET with inferior specifications would be sufficient, the purchase of this one from Botnroll allows reducing the delivery costs since the majority of the chosen electronics are also from the same company.
7.3.10 Switch
Table 33 contains details of the analog switch that allows the user to interface directly with the pump.
| Name | Description | Price (€) | Photo | Seller | Local of export | Weight (kg) | Datasheet |
|---|---|---|---|---|---|---|---|
| 3 A / 250 V AC TOOGLE MINI SWITCH | Terminal: 2x Solder Lugs Mounting Type: Central Nut Contact Voltage: 125 V AC Contact Current: 3 A Contacts Configuration: SPDT Mounting Hole: M5 ON-OFF Switching Method Toggle Type: Metal toggle | 0.65 |
| botnroll | Portugal | - | - |

Once again, the Botnroll store was prioritized due to cut shipping costs. This switch is the cheapest option of this store with the necessary electrical properties.
7.3.11 Power circuit
7.3.11.1 DC/DC converters-12 V/3.3 V and 5 V converter
The study of the 12 V to 3.3 V and 5 V converters available on the market can be found in Table 34.
| Name | Description | Price (€) | Photo | Seller | Local of export | Weight (kg) | Datasheet |
|---|---|---|---|---|---|---|---|
| DC-DC Buck Converter Step-down 12 V to 3.3 V / 5 V | One input: DC 6 V - 12 V Output: 3.3 V (+ - 0.05 V error), 5.0 V (+ - 0.05 V error) Max. current output: 800 mA Operating junction temperature range: -40 °C to + 125 °C Minimum operating current: 12 mA Short circuit current: 1.1 A | 3.81 |
| PTRobotics | Portugal (PTRobotics store) | - | Alldatasheet |
| 3.3 V And 5 V Breadboard Power Supply | Input voltage: 6.5 V to 12 V DC or via USB cable Output voltage: 3.3 V and 5 V Maximum output current: 700 mA. | 3.80 |
| Electrofun | Portugal (Electrofun store) | - | - |


Although the two converters have very similar characteristics and price, “DC-DC Buck Converter Step-down 12 V to 3.3 V / 5 V” was chosen because there is more information about it.
It is important to point out that the use of low-dropout regulator (LDO) is only acceptable in the case of the smaller scale prototype. For the real size product, the best solution is a buck switching regulator.
7.3.11.2 DC/DC converters - Wide input voltage/12 V converter
Table 35 presents the converters considered to convert the voltage range supplied by the photovoltaic panel to 12 V stable.
| Name | Description | Price (€) | Photo | Seller | Local of export | Weight (kg) | Datasheet |
|---|---|---|---|---|---|---|---|
| XL6009 DC-DC Boost Buck Adjustable Step-Up Voltage Converter Module | Module Properties: Non- isolated boost (BOOST) ; Rectification: Non- Synchronous Rectification Input Range: 3.8 V to 32 V Output Range: 1.25 V to 35 V Input Current: 3 A (max), no-load 18 mA ( 5 V input, 8 V output no-load is less than 18 mA Conversion efficiency: <94 % Switching frequency: 400 kHz Output Ripple: 50 mV (the higher the voltage, the greater the current, the greater the ripple) Load Regulation: ± 0.5 % ; Voltage Regulation: ± 0.5% Operating Temperature: -40 ℃ to +85 ℃ | 4.06 |
| PTRobotics | Portugal (PTRobotics store) | - | HAOYU STAR Electronics |
| Tension regulator LM2596 Conversor DC-DC Step Down | Input voltage: 4 to 40 V Output voltage: 3 to 35 V Output current: 2 A nominal current, 3 A max. (adviced to place a heat sink if power is greater than 15 W) Efficiency: up to 92 % (bigger output, greater the efficiency) Switching speed: up to 150 kHz; Max. output power: 15 W Temperature operating range: (-40 ℃ a 85 ℃) | 4.50 |
| Electrofun | Portugal (Electrofun store) | - |


The “XL6009 DC-DC Boost Buck Adjustable Step-Up Voltage Converter Module” was chosen because it allows the supplied panel voltage to be increased or decreased to obtain 12 V stable output. With this feature, the system is expected to run on solar power for longer.
7.3.11.3 Schottky diode
Table 36 lists the diodes to protect the circuit from changing the direction of current are considered.
| Name | Description | Price (€) | Photo | Seller | Local of export | Weight (g) | Datasheet |
|---|---|---|---|---|---|---|---|
| SB2100 - Schottky Diode 2 A 100V | Maximum reverse voltage: 100V Conducting current: 2 A Semiconductor structure: individual diode Capacity: 80 pF Housing: DO15 Pulse current max.:50 A | 0.18 x 3 units = 0.54 |
| PTRobotics | Portugal (PTRobotics store) | 0.383 | SMC Diode Solutions |
| SMC Diode Solutions | Max. peak reverse voltage: 40 V Max. rectified current: 3 A Repetitive peak forward current: - Max. reverse current (25 °C): 0.5 A Max. forward voltage: - | 0.40 x 3 units = 1.20 |
| Aquário | Portugal (Aquário store) | - | 1n5822.pdf |


The “SB2100” diode was chosen because it is the cheapest option with sufficient ratings for this project.
7.3.11.4 Power Supply AC/DC 12 V
Table 37 show some options to connect the prototype to the power grid.
| Name | Description | Price (€) | Photo | Seller | Local of export | Weight (kg) | Datasheet |
|---|---|---|---|---|---|---|---|
| Switching Power Supply 12 V 1.5 A | Input voltage: 110-240 V AC 50 / 60 Hz Output voltage: 12 V DC Current: 1500 mA Plug dimensions: 5.5 x 2.1 mm Dimensions: 80 x 53 x 33 mm | 4.80 |
| PTRobotics | Portugal (PTRobotics store) | 0.2 | - |
| Power Supply AC / DC 12 V 3 A Adapter | Input: AC 110-240 V to 50 / 60 Hz Output: 12 V DC Current: 3 A. | 6.30 |
| Electrofun | Portugal (Electrofun store) | - | - |


Considering a possible disparity between the current consumed by the system in theory and the actual consumption, the “Switching Power Supply 12 V 1.5 A” was chosen.
7.3.11.5 Photovoltaic panel
Table 38 compares possible types of installation with and without photovoltaic panels.
This study aims to conclude which is the best power system for the project.
| Type | Pros | Cons |
|---|---|---|
| Grid and Solar panel (no battery) ; Aka On-grid | These systems do not need batteries ; Can operate 24/7 ; Cheapest in the long term | Not able to function or generate electricity during a blackout, especially during in the night ;Partially dependent on the energy market |
| Off-grid (solar panel only) | Independent from the grid. Best choice for more remote areas that are far from the electricity grid. | Needs battery and respective control system. More expensive than on-grid because of the cost of batteries. |
| Grid and Solar panel + battery ; Aka Hybrid | Able to automatically isolate from the grid (known as islanding) and continue to supply some power during a blackout. ; Can operate 24/7 | Needs battery and respective control system ; Most costly system |
| Only grid (no solar panel) | These systems do not need batteries ; Can operate 24/7 ; Cheapest installment | Not able to function or generate electricity during a blackout ; Fully dependent on the energy market |
The best power source option for the project will be to use a system powered by the power grid and by a photovoltaic panel, without energy storage (aka on-grid). This system brings the greatest number of advantages:
- No cost with batteries, characteristic of off-grid and hybrid systems. These batteries also have extremely harmful chemicals for the environment.
- It can work in the same continuous, alternating between the power supplied by the solar panel and the power grid;
- Little impact of the energy market, as it works most of the time with energy from the photovoltaic panel, which also makes this system the most viable in the long term.
Table 39 presents some photovoltaic panels to power the prototype.
| Name | Description | Price (€) | Photo | Seller | Local of export | Weight (kg) | Datasheet |
|---|---|---|---|---|---|---|---|
| Photovoltaic Panel Silicon Monocrystalline 20W / 12 V | Nominal Power 20 W Cell type Monocrystalline ; Number of cells in series 32 Maximum power current (Imp) 1.23 A ; Maximum power voltage (Vmp) 16.2 V Open-circuit Voltage (Voc) 19.1 V ; Short circuit current ( Isc) 1.47 A Dimension 360 * 490 * 25 mm ; Weight 2 kg Maximum system voltage: 500 V Temperature coefficient of PMPP (%) -0.48 / °C ; Temperature coefficient of Voc (%) -0.34 / °C ; Isc temperature coefficient (%) + 0.037 / °C Temperature range -40 °C to + 85 °C Cable length / Connector type: 20 m/s, 6 g Output tolerance + 3 % Frame: Aluminum frame | 29.99 |
| Castro Electronica | Portugal (Castro Electronica store) | 2 | - |
| Photovoltaic Panel Silicon Monocrystalline 50 W / 12 V - ProFTC | Nominal Power 50W \\Cell type Monocrystalline ; Number of cells in series 36 Maximum power current (Imp) 2.75 A ; Maximum power voltage (Vmp) 18.2 V Open-circuit Voltage (Voc) 21.5 V Short circuit current (Isc) 2.23 A Dimensions 670 * 540 * 30 mm Weight 4.1 kg Maximum system voltage: 500 V Temperature coefficient of PMPP (%) -0.48 / °C ; Temperature coefficient of Voc (%) -0.34 / °C ; Isc temperature coefficient (%) + 0.037 / °C Temperature range -40 °C to + 85 °C Cable length / Connector type 20 m/s, 6 g Output tolerance + 3 % Frame, Aluminum frame | 49.99 |
| Castro Electronica | Portugal (Castro Electronica store) | 4.1 | - |


The research of photovoltaic panels available on the market allowed to conclude that the best option would be “Photovoltaic Panel Silicon Monocrystalline 20W / 12 V”. This the panel satisfies the minimum ratings to power the prototype and has an appropriate size.
7.3.12 Transport fees of Portuguese stores
During the research and selection of the electrical components, care was taken to use as few suppliers as possible, so that the delivery cost is shared among several components.
The suppliers considered and their delivery costs are shown in Table 40:
| Supplier | Delivery fee (€) |
|---|---|
| Aquário | 3.95 |
| Botnroll | 3.70 |
| Electrofun | 4.50 |
| PTRobotics | 4.31 |
7.3.13 Bird repeller
Table 41 shows several methods of keeping birds away.
| Name | Description | Set up | Price (€) | Photo | Seller | Local of export |
|---|---|---|---|---|---|---|
| Holographic Owl | Pack of two reflective owls + two rattles. This bird repellent emits unique visual flashes and sound effects to keep birds away like pigeons or sparrows. A very effective Anti-Pigeon product. Its reflective effect helps to protect wildlife, fruit trees, vegetable gardens, cultivated fields and newly sown lawns. This bird scavenger can also be positioned on the balconies as an excellent bird scare. Very economical, it does not hurt wild animals or cause damage to pets. Resistant - weatherproof. Maintains reflective effect for a long time. | This repellent can be affixed to trees, it can be suspended over plants, shrubs or plantations. For best results, apply this repellent before bird damage begins. | 6.26 + 4.92 (delivery fee) = 11.18 |
| ECOCED | Portugal |
| Bird Repellent Balloon | Visual scare-off system for birds that replicates of the eyes of bird predators in a 3D balloon, efficient in combating several types of birds. The visual effects obtained by moving these balloons in the wind is extremely intimidating and aims to keep birds away from the places. | 1. Fill the ballon ; 2. Place Mylar (included) in pupil of the balloon ; 3. Attach the Mylar tail to the bottom of the Bird Hunting Balloon ; 4. Hang the balloon | 12.29 + 4.92 (delivery fee) = 17.21 |
| ECOCED | Portugal |
| Ribbon scare Birds | Repellent tape that emits visual flashes of light in a unique way, creating movement in order to ward off wild animals such as birds and deer. With the help of the wind, this repellent tape reflects sunlight in a multicolor pattern that works like a scarecrow, sending birds a danger signal and a “recommendation” to leave the place. The presence of these flashes gives the birds the feeling that there is a predator or a rival in the area. | Hang strips of tape near the spot you want to protect. | 2.63 + 4.92 (delivery fee) = 7.84 |
| ECOCED | Portugal |


Bearing in mind that the bird repeller aims to keep birds away, the type of method that will work best will be one that has an effect on an area around the place where it is placed, rather than limiting an area with a barrier physical.
So “Holographic Owl” was chosen to fill this need, as it has the following characteristics:
- Easy to install, taking into account that the prototype is on the shore of a lake;
- It has three factors that intimidate birds, these being reflective surfaces, rattle sounds and the shape of a predatory bird;
- It is resistant to the environment because it is made of metal.
7.4 Final list of components
Table 42 contains the final list of materials, along with the total cost and operating temperature.
| Functionality | Name | Price (€) | Operating temperature range (°C) |
|---|---|---|---|
| Custom-made and existing components | Raw materials: Stainless Steel, PU, TPU, PMMA, PET | 65.82 | - |
| Pump | Velleman VMA421: Water Pump | 12.20 | -10 to +60 |
| Distance sensor | JSN-SR04T-2.0 Ultrasonic Waterproof Range Finder | 16.50 | -10 to +70 |
| Water level sensor | Water level sensor | 2.90 | 10 to +30 |
| Temperature sensor | DS18B20 | 4.65 | -10 to +85 |
| Microprocessor | Espressif ESP32 DevKitC-32D | 13.60 | –40 to +85 |
| Logical level converter | 3.3 V & 5 V Logic Level Converter | 2.50 | - |
| MOSFET | BS170 | 0.31 | –55 to +150 |
| Switch | 3 A / 250 V AC TOOGLE MINI SWITCH | 0.65 | - |
| 12 V to 3.3 V and 5 V DC/DC converter | DC-DC Buck Converter Step-down 12 V to 3.3 V / 5 V | 3.81 | -40 to +125 |
| Wide input voltage to 12 V DC/DC converter | XL6009 DC-DC Boost Buck Adjustable Step-Up Voltage Converter Module | 4.06 | -40 to +85 |
| Schottky diode | SB2100 - Schottky Diode 2 A 100 V | 0.54 (3 units) | -55 to +150 |
| Power supply AC/DC to 12 V | Switching Power Supply 12 V 1.5 A | 4.80 | - |
| Photovoltaic panel | Photovoltaic Panel Silicon Monocrystalline 20 W / 12 V | 29.99 | -40 to +85 |
| Bird repeller | Holographic Owl | 6.26 | - |
| Delivery fees | . | 3.95 + 3.70 + 4.50 + 4.31 + 4.92 = €21.38 | . |
| Total | . | 189.97€ | water bin: 10 °C to 30 °C; on land part: -40 °C to +85 °C |
7.5 Power Budget
This information is divided in tables between the main system loads, power distribution circuit and power sources. These tables include the input and output values of each of the components, as well as the components direct connected and the total value of the electrical current, power and voltage.
7.5.1 Main loads of the system
In the table 43 are the power budget for the main system loads.
| Component | Input Voltage [V] | Input Current [A] | Input Power [W] | Powered by | Output Voltage [V] | Output Current [A] | Output Power [W] | Powering |
|---|---|---|---|---|---|---|---|---|
| Pump | 12.0 DC | 0.350 | 4.200 | Motor driver | - | - | - | - |
| Ultrasonic sensor | 5.0 DC | 0.030 | 0.150 | 12 V to 3.3 V and 5 V DC/DC converter | 5.00 DC | - | - | - |
| Water level sensor | 3.3 DC | 0.020 | 0.066 | 12 V to 3.3 V and 5 V DC/DC converter | 2.30 DC | - | - | - |
| Temperature sensor | 3.3 DC | 0.001 | 0.003 | 12 V to 3.3 V and 5 V DC/DC converter | 3.30 DC | - | - | - |
| Microprocessor | 3.3 DC | 0.500 (minimum demanded by source) | 1.650 | 12 V to 3.3 V and 5 V DC/DC converter | 2.64 DC | 1.10 (max) | 2.904 | - |
| 3.3 V & 5 V logic level converter | 3.3 DC and 5.0 DC | - | - | - | 3.30 DC and 5.00 DC | - | - | - |
| MOSFET | 12.0 DC | 0.350 | 4.200 | Microcontroller | 12.00 DC | 0.35 | 4.200 | - |
| Total Input | - | 0.900 | 6.010 | - | - | - | - | - |
7.5.2 Power Distribution Circuit
Table 44 list the components that make the power distribution circuit.
| Component | Input Voltage [V] | Input Current [A] | Input Power [W] | Powered by | Output Voltage [V] | Output Current [A] | Output Power [W] | Powering |
|---|---|---|---|---|---|---|---|---|
| 12 V to 3.3 V and 5 V DC/DC converter | 12 DC | 0.551 + 0.012 (logic circuit) = 0.563 | 1.87 + 0.144 (logic circuit) =2.014 | Wide input voltage to 12 V DC/DC converter or Power supply AC/DC to 12 V | 3.3 DC(for MCU, temperature sensor and water level sensor) and 5 DC( for ultrasonic sensor) | (0.5+0.020+0.001) + (0.03) = 0.551 | 1.72 + 0.15 = 1.87 | Microprocessor and Sensors |
| Wide input voltage to 12 V DC/DC converter | 3.8 to 32.00 DC | 1.230 | 20.000 | Photovoltaic panel | 12 DC | 0.563+0.35=0.913 | 2.014 (12 V to 3.3 V and 5 V DC/DC converter) + 4.2 (Pump) = 6.214 | 12 V to 3.3 V and 5 V DC/DC converter and Pump |
| Schottky diode | 12.0 DC | 0.913 | 6.214 | - | 12 DC | 0.913 | 6.214 | - |
| Total Output | - | - | - | - | - | 0.913 | 6.214 | - |
7.5.3 Power Sources
Table 45 displays the power sources of the system.
| Component | Input Voltage [V] | Input Current [A] | Input Power [W] | Powered by | Output Voltage [V] | Output Current [A] | Output Power [W] | Powering |
|---|---|---|---|---|---|---|---|---|
| Power supply AC/DC to 12 V | 100 to 240 AC 50/60 Hz | - | - | Electrical grid | 12.0 DC | 1.50 (max) | 18 | 12 V to 3.3 V and 5 V DC/DC converter and Motor Driver |
| Photovoltaic panel | - | - | - | Sun | 16.2 DC (max) | 1.23 (max) | 20 | Wide input voltage to 12 V DC/DC converter |
7.6 Functionalities
7.6.1 Fluid mechanics
In the process of developing a product that operates in a lake, it is necessary to consider the mechanics of fluids and the relevant forces.
7.6.1.1 Overview
Archimedes' principle states that any object, wholly or partially immersed in a fluid, is buoyed up by a force equal to the weight of the fluid displaced by the object.
An object floats when the weight force on the object is balanced by the upward force of the water on the object. The upwards force increases with the volume of the object that is underwater; it is not affected by the depth of the water or the amount of water. If the weight force is larger than the upward push of the water on the object then the object will sink. If the reverse is true, then the object will rise above the waterline. Different objects float at different levels in the water because, as most regular objects enter the water, the upward push of the water steadily increases until it is in balance with the weight force of the object, and the object then continues floating at this level with the two forces in balance. Many objects that are hollow (and so generally contain air) float because the hollow sections increase the volume of the object (and so the upwards push) for very little increase in weight force down. No object can float without some part of it being below the surface of the water[Department of Education, Training Victoria, 2018].
In conclusion, in the process of designing the shape and choosing the materials, the following statements have been considered:
- To float, the weight force on an object must be balanced by the upward push by the water on the object.
- The amount of material and the type of material that makes up the object affects the size of the weight force on the object.
- The volume of the object, which can often be altered by changing the shape, will affect the size of the upward push on the object[Department of Education, Training Victoria, 2018].
7.6.1.2 Desired buoyancy
There are three types of buoyancy: positive, negative, and neutral.
Positive buoyancy happens when the submerged object is lighter than the fluid it displaces. The object floats because the buoyant force is greater than the weight of the object.
Negative buoyancy occurs when the object is denser than the fluid it displaces, so the object will sink because its weight is greater than the buoyant force.
The last type is the neutral buoyancy, meaning that the weight of the displaced fluid is the same as the weight of the object.
When it comes to Soaksy's buoyancy, it needs to have a positive buoyancy overall, because it always floats, but it also needs to make sure that when it floats, the water level rises (and stays) at the very top of the inner part, as shown in Figure 33. A very thin layer of water would enter the bin, as in a waterfall movement.

If the water level stays at the very top of the inner bin, this implies that the overall weight of the bin is the same as the weight of the water that the bin displaces. The volume of displaced water consists of the volume of the body submerged, the volume that the pump occupies, and the volume of air inside the body (where the water is falling in like a waterfall). This latter volume is considered because it is not desired to be filled with water, but with air, so it is also a volume of displaced water. The volume of displaced water is around 47 000 000 mm3, so around 47 liters. The density of water changes with temperature and, very slightly, with pressure. However, its density is approximately 1 g/cm3, meaning that 47 liters are equal to 47 kg.
These 47 kg need to be balanced by an equal weight. Without an extra weight to balance this, the product weighs around 16.5 kg. By adding a small body of water that would allow the pump not to run dry, another 4.5 kg is added. To balance the remaining mass, a 26kg body of steel is added to the bottom of the body.
7.6.2 Hardware
7.6.2.1 Sensors
The system uses three sensors to maintain a normal control of operation.
The ultrasonic sensor is used to measure the waste level inside the collector, the water level sensor measures the water level inside the collector and the temperature sensor measures the temperature of the water expelled by the pump.
7.6.2.2 Water pump
The water pump is the most important part of the system, constantly extracting water from the bin. The pump can be controlled automatically, through the control system, or manually, via a switch.
7.6.3 Software
7.6.3.1 IoT Platform
The IoT platform presents the information in a more intuitive and accessible way.
The Thingspeak online platform was chosen for the following reasons:
- Free version with enough options for an intuitive and complete presentation;
- Easy registration and sharing of dashboards;
- The only free IoT platform able to connect to the Tinkercad simulation platform.
This dashboard is configured to display the waste level and the status of the water pump.
The gauge “Bin capacity (%)” shows the capacity of the collecting bucket as a percentage. An important feature of this display is the transmission of the system status through text in the middle of this gauge. This feature allows to inform the user of the following situations: the bucket is full (Full!) , connection with the lost sensor (Sensor Lost!), inconclusive reading (Inconclusive!) or without information to display (No Data!).
The “Field 1 Chart” shows the distance readings as a function of time, allowing the user to have access to a history of readings if needed.
The red LED “Pump_OFF” shows the status of the pump, lighting up if off. The “Field 2 Chart” shows the state of the pump as a function of time, allowing the user to have access to a history of readings if needed.
The figure 34 shows the dashboard described.

7.7 Tests and Results
There will be discuss two types of simulations/tests. One that is linked to the electronics, the sensors and the circuit, and another type that is linked to the behavior of the materials and how they react to solicitations.
The simulations of the different possible situations in the functioning of the system were conducted through the online Tinkercad stimulation platform. However, this platform did not have all the necessary components for an exact simulation of the proposed system. The most notable modifications were:
- Replacement of the ESP32 development board with the Arduino Uno development board to communicate with the ESP8266 microcontroller;
- Replacement of the water level sensor with a potentiometer;
- Replacement of the power distribution system with a 12 V and 3 A voltage source, with voltage regulators with 3.3 V and 5 V outputs.
The circuit used for the simulations is shown in Figure 35.

7.7.1 Tinkercad voltage regulators simulation
This simulation focused on testing the power circuit of the rest of the system. For this simulation to be successful a 12 V DC voltage had to be converted to 5 V and 3.3 V.
Using appropriate voltage regulators and following the recommendations of the respective datasheets, success was achieved, as can be seen in the Figure 36.

7.7.2 Tinkercad and Thingspeak water level sensor and temperature sensor controlling pump simulation
This simulation aimed to test the response of the water pump engine to water level and temperature variation within the collecting bucket and consequent response from the Thingspeak online platform dashboard.
As in the Tinkercad platform there is no water level sensor, it had to be simulated with a potentiometer. This component is suitable for simulating such a sensor as both components have an analog variable resistance output.
In the case of the potentiometer such variation is regulated by direct user intervention whereas in the case of the sensor this variation occurs due to the variation of the water conductivity level. The more submerged the sensor is, the less resistance it has and vice versa.
The system is programmed so that when the water level is at 40 cm, the maximum measure possible with the chosen water level sensor, simulated with potentiometer as the lowest possible resistance and consequently high voltage level at its output, the voltage level at the MOSFET gate, used to control the motor, is high, which in turn brings the MOSFET to the saturation zone, acting as a closed switch, so the motor is activated.
The same principle is applied in the case of the temperature sensor. When the sensor detects a temperature above 30 °C the system is programmed to switch off the engine, with the same procedure as the water level sensor. The 30 °C temperature limit is set by the water level sensor, which after this temperature can damage this sensor.
The user also has direct control of the motor operation via an analogue switch, although by turning off the pump in this way it is not registered on the Thingspeak platform as an off motor.
An important detail to note is that the first reading of the engine status displayed on the Thingspeak platform is always off. At the next reading the engine will appear switched on, if the necessary conditions are met.
The simulation was successful and the results can be seen in the following video.
7.7.3 Tinkercad and Thingspeak ultrasonic sensor communication simulation
The next simulations focus on the behavior of the dashboard as a function of different distance values sent by the microcontroller.
7.7.3.1 Normal operation simulation
This simulation aimed to test the response of the dashboard of the online platform Thingspeak according to distance values within the specified range of operation.
The range of distances from the ultrasonic sensor, after treatment by the microcontroller, is 0 cm to 333 cm. However the useful range used by the system for normal operation is 25 cm to 50 cm. The minimum of 25 cm is due to the limitations of the ultrasonic sensor used in the prototype, while the maximum of 50 cm is the distance between the ultrasonic sensor and the wall of the collecting bucket.
The gauge “Bin capacity (%)” shows the distance values in percent and in reverse, i.e. the distance of 25 cm corresponds to the maximum capacity of 100 % while the distance of 50 cm corresponds to the minimum capacity of 0 %.
While the meter displays values in the normal operating zone, the warning “Capacity:” is present in the middle of the meter. This warning indicates to the user that the bucket is not yet near the maximum capacity.
In this range of operations there is the particularity of highlighting when the bucket is close to maximum capacity. This situation is shown to the user when the distance values are less than 30 cm, corresponding to values greater than 80 % on the gauge. The gauge hand enters the red zone and the warning changes to “Full!
The simulation of these situations has been successful and is found in the following video.
7.7.3.2 Inconclusive reading simulation
This simulation aimed to test the response of the dashboard of the online platform Thingspeak according to distance values outside the specified range of operation.
As explained in the “Normal operation simulation”, the range of distances from the ultrasonic sensor, after treatment by the microcontroller, is 0 cm to 333 cm. However the useful range used by the system for normal operation is 25 cm to 50 cm.
Values outside this range are displayed as 0 % on the gauge, accompanied by the warning “Inconclusive!”.
Although these values are outside the range of distances considered normal for system operation, the occasional display of this warning does not necessarily mean that there is a problem with the system. Uneven surfaces of collected waste can create ultrasonic sensor readings out of the range provided. However, if this situation continues over time it may mean that the system is not working properly and should be inspected by the user.
The simulation was successful and the results can be seen in the following video.
7.7.3.3 Ultrasonic sensor disconnected simulation
This simulation aimed to test the response of the dashboard of the online platform Thingspeak in the event of a connection failure between the ultrasonic sensor and the microcontroller.
This may occur due to power or information wire breaks or may also be a problem with the sensor's internal circuitry. In response to such an occurrence the microprocessor interprets the distance as 0 cm.
On the online platform part, the gauge meter shows the bucket capacity as 0 % accompanied by the warning “Sensor Lost!”
In this case, the user must inspect the ultrasonic sensor and wiring.
The simulation was successful and the results can be seen in the following video.
7.7.3.4 No data available simulation
This simulation aimed to test the response of the dashboard of the online platform Thingspeak in the event of no information is available to display.
This situation occurs in the dashboard configuration and is evidenced by the gauge with the value of 0 % and warning “No data!”. After the first value is received by the Thingspeak platform this warning no longer appears unless the channel information entries are clean of the platform.
The simulation was successful and the results can be seen in the following video.
7.7.4 Stress simulations
To make sure that the main body, which carries most of the loads, resists in any circumstance, the worst-case scenario simulation eliminates any doubts when it comes to potential flaws in the design. In this case, the worst-case happens when Soaksy is carried by holding only one of the lower parts of the floaters. However, this case is unlikely to happen, because it is easier for the user to hold the main body with both hands, by two of the lower parts. This scenario can happen both outside of the water and inside.
7.7.4.1 Stress simulation outside the water
The main load that acts on the product is the weight of the stainless steel body. It weighs around 26kg, which, as a load, is the equivalent to 255 N. To make this scenario even worse, it will be consider a load of 260 N, and gravity force.
Figure 37 shows the minimum safety factor that occurs in the body, and that it resists very well in this situation.

Figure 38 shows the stress on the body, in MPa.

7.7.4.2 Stress simulation in the water
The difference between the case where the body is out of the water is that there is not only the weight of the stainless steel body, but also the hydrostatic pressure. It will be consider a load of 260 N, hydrostatic pressure, and gravity force.
Figure 39 shows the minimum safety factor in the body, and that it has no potential to break.

Figure 40 shows the stress on the body while functioning.

7.8 Conclusion
The development of the project began after defining the project to be done and the research done in the state of the art. With the creation of the Black box Diagram began to advance with the technical part of the project. After iterations of the Black Box Diagram was understood the steps that would follow to complete the project.
Thus began the technical drawings of the project, both structural and electrical. Regarding the structure of the project, the technical drawings led to the creation of a 3D model, while in the electrical part the electrical schematic was developed.
With both parts defined, the research and choice of components continued, once again, both structural and electrical. As for the electrical materials, it was necessary to check if they were compatible using the Power Budget.
Following the choice of materials, it was necessary to define the functionalities of the project. These functionalities require further tests to verify if they are possible to implement. These tests were performed through simulations so that the functionalities regarding physical components are less ideal than digital simulations.
The next chapter of the conclusions will reflect on the fulfilment of the initial objectives as well as future developments to turn the planned prototype into a product.
8. Conclusions
8.1 Discussion
The goal of this project was to design and develop a new environmental friendly product that would be viable on the market and would not conflict with ethical, deontological and sustainable concerns. The team decided to design and develop a product that contributes to collecting floating trash that has already ended up in natural waters. First requirement, collecting the trash should be done continuously and automatically. Second requirement, the product should also be an educational tool for people. Because lakes are closer to human interaction than oceans, the team decided to collect floating trash in lakes. This makes the product a visible solution and the water pollution a visible problem.
Firstly, a detailed marketing plan was created to specify the competitors, the strengths and weaknesses of the product, the adapted marketing mix and the target customers.
Secondly, the team studied the sustainability of the product by understanding what sustainability means, searching for the regulations around sustainability, searching for eco-efficiency solutions and analysing the life cycle assessment.
Thirdly, different ethical and deontological concerns were analysed. The team discussed engineering, sales, marketing and environmental ethics, and also the liability of the product.
Finally, the project developed more and more during this semester. It started with defining the project and doing research to already existing similar products and ideas. The technical part started with creating the Black Box Diagram. This diagram showed the steps that should be followed to complete the project. Then the technical drawings of the project were created, both structural and electrical. Based on the technical drawings, the 3D model and electrical schematic were developed. Then the research and choice of materials for the product continued. Last, the functional tests were defined and tested through simulations. Due to the pandemic, the prototype could not be developed and thus could not be tested. That is why the functionalities regarding physical components are less ideal than digital simulations. The team succeeded to meet deadlines and achieve almost all the goals of the project.
The general goal of the EPS@ISEP programme was to offer of project-based learning experience and to challenge the team members from multiple educational backgrounds and nationalities to join their competences to solve a real life problem. This team definitely achieved this. All team members can agree that they enjoyed working in a multicultural and multidisciplinary team. We learnt from each other and had fun with each other. The expectation of our exchange was obviously different from reality, because of the pandemic. We expected to go to school every day, get to know each other really well, learn some Portuguese and learn about project management, marketing, ethics, sustainability and project development. Also, we expected to travel the beautiful country that Portugal is. In reality, we got to know each other a bit, and learnt about these different subjects in online classes. We think ISEP did well on the distance learning. We are thankful for this experience and thankful for our great team members.
8.2 Future Development
The prototype that was presented is of a very small scale. In order to become a product that can compete in the market it will have to be increased in scale.
Starting with the water pump, to continue to be powered by a 12 V DC source, it will have a maximum flow rate of approximately 4400 l/hour, according to research conducted in the Portuguese market.
With the main load of the system chosen, the next component to be sized will be the MOSFET that will make the connection between the pump and the microcontroller. Besides having to choose a MOSFET with appropriate electrical characteristics, it will also be possible to make an improvement in the system. With access to the pump, tests can be carried out to check the voltage limits that it can operate, so that it can be controlled on and off more smoothly, using the PWM technique. It was not possible to apply this technique to the development of the prototype as there was neither access to the pump nor sufficient information to run the pump safely.
The next components to be sized will be the power supplies and the respective Schottky diodes. Although the mains power supply can be sized by choosing another component of higher capacity, for the photovoltaic power supply not only a higher capacity photovoltaic panel will be required but also a DC/DC converter with optimized output to the system loads.
In short, the components to be changed would be the pump, MOSFET, AC/DC transformation circuit, photovoltaic panel and the associated DC/DC converter, the remaining components could, in theory, remain in the circuit of the final product.
An additional feature to the product would be the measurement of pollution levels in the water. With this feature the product could monitor the quality of the water body it is placed, giving statistics on how the use of the product affects the aquatic environment.
Another addition to the product would be the option of using waste collection containers capable of filtering oil from the water and even capturing microplastics.
The results showed that the body resists well to the loads applied, both in and out of the water, meaning that it has no potential to break. The system is well balanced if the amount of water (the weight) inside stays the same. In real life, the weight of the product (the amount of water that exists inside) always fluctuates. Even if it fluctuates between two close levels (thanks to the water level sensor), the difference is not always insignificant. A slight change in weight can make the product sink a few millimeters. When it sinks, the debit of the water that gets inside changes. The area used by the water to get inside (the difference between the lake level and the margin of the inner bin) increases, and the speed of water does the same.
Unfortunately, the environment is unstable and there are many unknowns. They can either be solved by advanced calculations, either by physically testing the prototype.
A change in the design might also make some improvements. Increasing the air volume in the floaters would make the product float even if it is full of water. However, this would imply a big change in their size, which would create other changes, such as the overall weight and not good-looking design, since they might be bigger than the middle body.
9. Bibliography
Will be added automatically by citing, in the body of the report, entries specified in BibTeX format and stored in the http://www.eps2020-wiki1.dee.isep.ipp.pt/doku.php?id=refnotes:bib file
PS - If you have doubts on how to make citations, create captions, insert formulas, etc. visit this page with examples and select “Show pagesource” to see the source code.